
Introduction:
We are researching the opinions on Maths/ STEM of students who are doing year 9 mathematics. We chose this as STEM is a field growing in size, and mathematics and STEM are now seen as more than a subject in school. The categorical question we had was “The topic in Maths I find the most enjoyable and interesting is…” and the numerical question was “In your life beyond school, how many days per week do you foresee yourself using mathematics (for work or life)?”. Some of the extra avenues for parallel data analysis that we use include by gender and by class. These results are needed to investigate what the students doing year 9 mathematics think/ do/ need/ want.
Validity and Reliability:
The non-probability sampling method used in this project was a convenience sample (non-probability sample method) which is everyone learning year nine mathematics.
This sampling method is prone to bias because the participants don’t represent a cross section of the population as all the participants are of the same/similar age group. The sample size was the 141 people, and there was sampling bias as the only people sampled were students learning year nine math. The generalization that is made is that because we only surveyed people learning year nine mathematics, this means that we can only draw conclusions and make statements about this type of people (the certain age bracket of 12-14)
The non response bias in the survey:
Question Order Bias:
- People would have become tired and bored by the end of the survey (as it was very long and contained many questions)
- The owner of the survey tried to avoid the problem of the questions affecting each other, but there was not anything to do to minimize/limit boredom.
Social Desirability Bias:
- This wasn’t really avoided as there wasn’t anonymity of the responses and the students wanted to give the socially acceptable answer. There was apparent anonymity as names were not shared with the students, however, it was easy to see who was who, and this is obvious when viewing the results ( as the results all lined up to show a nameless profile of each student learning year nine maths. This would not be able to be avoided because in the event that the results were randomized so it didn’t show up in order for each person, we wouldn’t be able to have parallel data analysis.
- There wasn’t any Yes-man phenomenon as the students didn’t know what the owner of the form would have wanted.
Ways Bias was avoided:
- There were no double negatives
- There was no/ limited jargon and technical language
- None of the questions were leading to a specific reply
Ways Bias was included, and how to not be biased:
- “What is your favourite topic in maths?” – The list of topics which could be chosen was long, and people might get bored and stop reading. This can be fixed by ordering it into rows so there would be multiple options on the same row.
- There is no option for people who do not like mathematics or have another favourite do not have an option, and will therefore need a ‘other’ or/and ‘none’ option.
- Sampling bias – only using year 9 mathematics students. This could have been avoided by surveying a larger range of people, such as sending the survey to the whole school. It probably could not be avoided that we only surveyed students from All Saints’ College as it would be hard to get people out of the All Saints’ community to take part in the survey.
- Sample size – to get more accurate results, a larger sample size would be beneficial. This would be especially important in some places, such as when using parallel data analysis with gender, as there were not many people who were non-binary, and therefore, their views could not be represented properly.
Favourite Maths Topic
| Algebra and equations | 56 |
| Functions and graphs | 5 |
| Geometry | 17 |
| Measurement | 22 |
| Probability | 23 |
| Rates, ratios and percentages | 6 |
| Statistics | 12 |
| MODE | Algebra and Equations (56) |
Days of Math beyond School
| MEAN | 3.709219858 |
| MEDIAN | 3 |
| MODE | 7 |
| RANGE | 7 |
| Quartile 1 – 25% | 2 |
| Quartile 2 – 50% | 3 |
| Quartile 3 – 75% | 6 |
| Quartile 4 – 100% | 7 |
| INTER-QUARTILE RANGE | 4 |
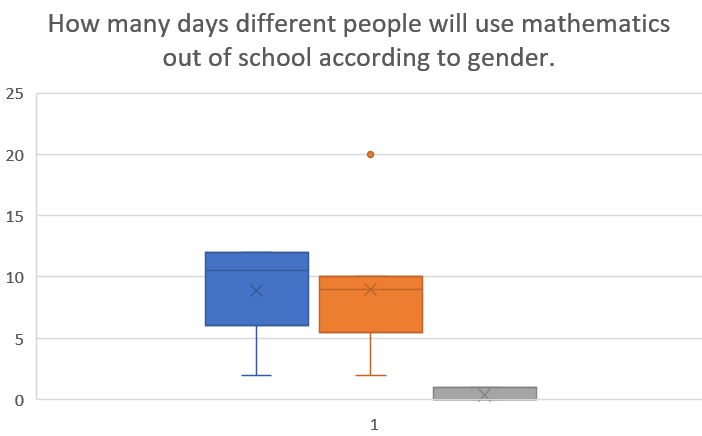
Days of Math beyond school according to gender
| FEMALE | MALE | NON- BINARY | |
| Mean | 3.01515152 | 4.30555556 | 4.666667 |
| Mode | 1 and 2 | 7 | all |
| Range | 7 | 7 | 6 |
| Quartile 1- 25% | 1 | 2 | 3.5 |
| Quartile 2- 50% | 2.5 | 5 | 4 |
| Quartile 3-75% | 5 | 7 | 5.5 |
| Quartile 4-100% | 7 | 7 | 7 |
| Interquartile range | 4 | 5 | 2 |
CATEGORICAL
For the categorical question “Which topic in mathematics do you enjoy the most?”, 56 people chose algebra and equations; 23 people chose probability; 22 people chose measurement; 17 people chose geometry; 12 people chose statistics; 6 people chose rates, ratios and percentages and a mere 5 people chose functions and graphs. The mean was algebra and equations, which was 39.72% of the students who took the survey. Topics such as Functions and Graphs, Measurement, Probability, Rates, ratios and percentages and statistics are less challenging, and therefore it will be more enjoyable for the less mathematically inclined students that take Applications. Methods students find more challenging topics such as Algebra and Geometry (which are Methods students modal topics) more stimulating and exciting, therefore these are their most common favourite topics.
By Course:
Algebra: 50 Methods students and 5 Applications students chose Algebra. Not surprisingly, those in the Methods course most commonly chose Algebra as their favourite topic.
Functions and Graphs: 4 Applications and 1 Methods students chose Functions and Graphs. This could indicate that this topic is less challenging.
Geometry: 4 Applications and 13 Methods students chose Geometry as their favourite.
The Methods students seem to gravitate towards Algebra and Geometry, which may indicate that these topics are more stimulating for them, as it is more challenging.
Measurement: 11 Applications and 10 Methods students chose Measurement as their favourite. Measurement is challenging for some, but easy and enjoyable for others as seen in the results, where nearly an equal number of applications and methods students chose Measurement.
Probability:13 Applications and 10 Methods students chose Probability.
Rates, ratios and percentages: 2 Applications students and 4 Methods students.
Statistics: 6 Applications and Methods students chose Statistics. Statistics is equally popular between the 2 courses. This means that perhaps it involves less complex math, as it understandig and comprehending the data.
Topic in contrast to gender:
Algebra: 27 females, 28 males and 1 non binary.
Functions and Graphs: 2 females, 3 male and 0 non binary.
Geometry:4 female, 13 males, 0 non binary.
Measurement: 11 females, 11 males, 0 non binary.
Probability: 14 females, 9 males
Rates, ratios and percentages:3 female, 3 male, 0 non binary
Statistics: 5 females, 5 males, 2 non binary
NUMERICAL
For our numerical question “In your life beyond school, how many days per week do you foresee yourself using mathematics (for work or life)?”, 11 people said 0 days a week, 21 people said 1 day a week, 22 people said 2 days a week, 17 people said 3 days a week, 13 people said 4 days a week, 20 people said 5 days a week, 4 people said 6 days a week and 33 people said 7 days a week. The shape of the distribution was irregular – there wasn’t much of a pattern. However, when looked at with parallel data analysis using gender, we can see that females tended to choose less days a week then males. This may be because of their ideas for what they would like as a future career. A surprising feature of the results was that only 4 people chose 6 days.
| MEAN | 3.71 |
| MODE | 7 |
| RANGE | 7 |
| QUARTILE 1 | 2 |
| QUARTILE 2 | 3 |
| QUARTILE 3 | 6 |
| QUARTILE 4 | 7 |
| Interquartile range | 4 |
infogram:
https://infogram.com/math-statistics-1h7z2l8djjj3x6o?live
The data we had from the survey allowed us to relate and understand many things about the results. Some limitations of the work, however, include the bias, especially the sampling bias as we could only find out the results from students doing year 9 mathematics at All Saints’ College. For future research in this area, it would be beneficial to survey a wider range of students, and assess the survey questions more thoroughly for bias. Overall, I enjoyed this task because I was able to learn about the opinions of students on STEM and mathematics as well as using mathematics in the research.

Leave a Reply