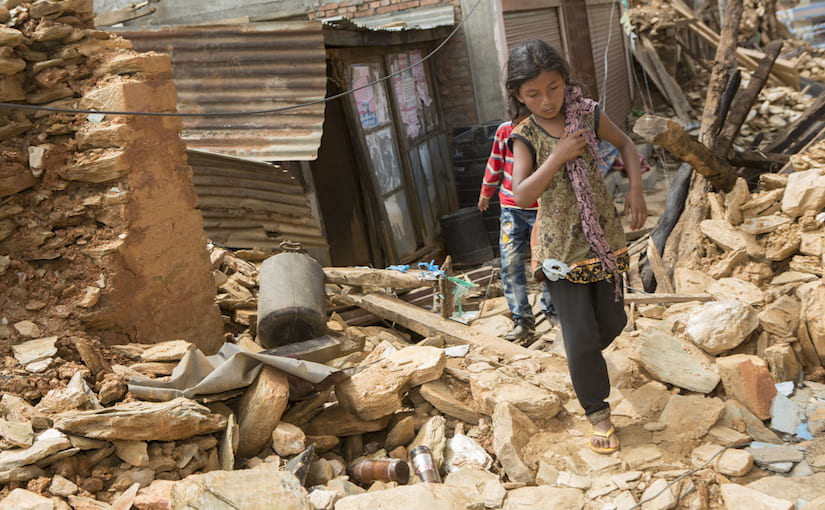
The destructive and unpredictable nature of earthquakes can not only wreak havoc on buildings but negatively impact surrounding societies, causing uncertainty and fear. In addition to injuries, organizations and infrastructure may be disrupted. Hence, the long-term repercussions of this are socially, economically and environmentally unsustainable. This was demonstrated through the Nepal 2015 earthquake. In the 2 year aftermath, less than 5% of the destroyed houses were rebuilt, leaving 800, 000 families to take refuge in temporary shelters. If we understand how to engineer earthquake-safe buildings, we will be able to better resist the inevitable damage brought upon us, which would save lives, infrastructure and organizations, creating a safer society for all to reside in.
To end our science course, we were tasked with designing, building and testing a model that would withstand a major earthquake. To be considered successful, this model:
was to be made out of spaghetti and blu-tack
had to remain standing after an earthquake, as simulated by the 10-second shake of a table. Ideally, it had to be left undamaged after P Waves, S Waves & Surface Waves.
had to be quick and easy to assemble
constructed using scissors and a ruler
It was required to have
a maximum base of 30cm by 30cm
a minimum height of 60 cm
a 5 cm by 5 cm platform at the top
a cost less than $60, where each spaghetti strand or gram of blu-tack costs $1. (This was given twice for the initial prototype and once for the second prototype.)
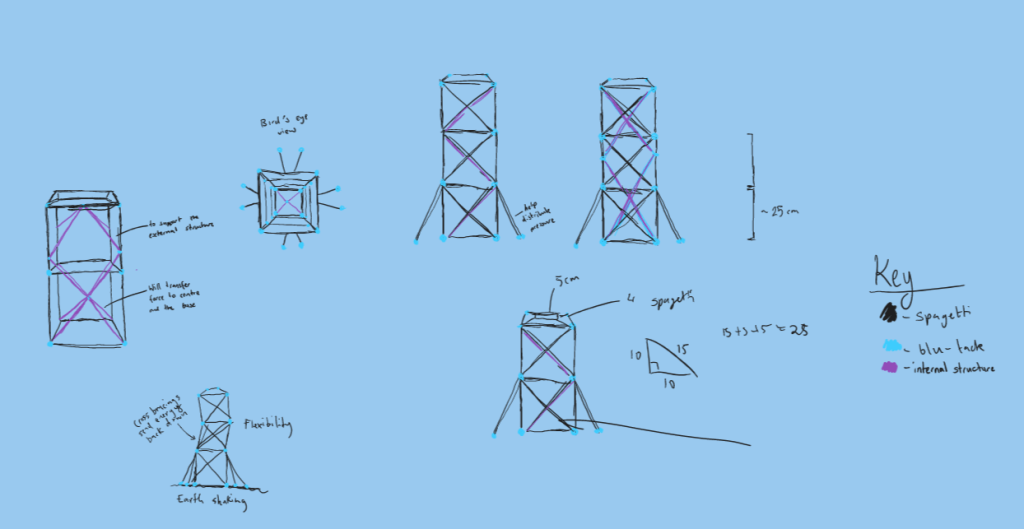
Concept sketches of our intended model that was unsuccessful.
We first engaged in a 50-minute design sprint, and then researched, created a plan and engineered a model based on this. Throughout the process, we kept in mind the design features that would help improve building resistance. As a result of this, our final model was drastically different.
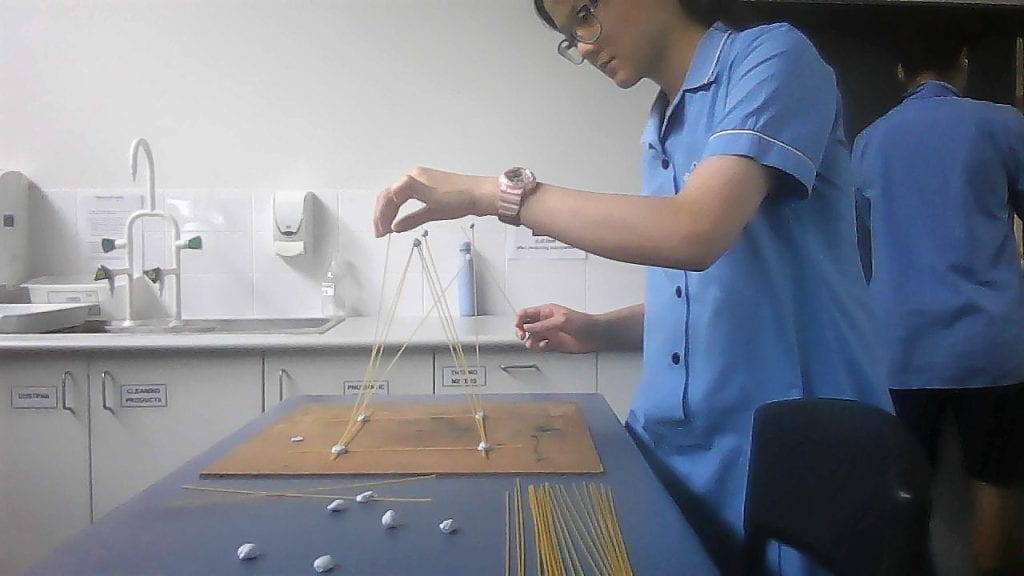
While our building was stable, a piece of spaghetti snapped, dislodging others.
Our building was able to withstand all types of waves, however, due to unforeseen circumstances arising from snapped spaghetti, the fragility of the materials and the interactions between the blu-tack and spaghetti, we were forced to alter, adapt and change our plan. This caused us to have a lack of resources as we neared the top of our model, meaning that we missed the height requirement by a few centimetres. However, we learnt that having a top that is flexible and able to sway on a rigid base is not necessarily a negative. Overall, though the building could not be implemented in real life, it fulfilled most requirements, with the exception being the height.
I thought that our research was thorough, however, as it couldn’t perfectly correlate to real life, it was partly for naught. In terms of teamwork, I thought that we collaborated by distributing the work evenly and taking initiative as required.
To improve the outcomes of the project, it would have been beneficial to spend less time observing, deliberating and researching, to allow more time to iron out any inevitable problems or experiment more with bases that would work and think about how theory applies to real life (by taking into account the specific materials we have on hand).
This is my Individual Pathway Story, detailing my present and how this might lead to my future aspirations. This revolves around 3 main themes: The Self, My Learning and My Working Future. The intended outcome of this task was to allow the student to explore their current self and their future opportunities in the professional world.
The Self
The first section of this task explores personal identity and perception. I believe that the values form a basis for identity, as one relies on them heavily to make decisions, and this influences what one holds in esteem as well.
My values can be summed up as integrity, persistence and conscientiousness. My first value, integrity, ensures that I can live in an authentic and honest manner with those around me, by following effective rules and behaving in a morally correct manner. My second and third values, persistence and conscientiousness, are quite closely linked. I prefer to make deliberate choices and work towards long term goals in an efficient manner so I might fulfil my highest need, Self Actualization. Another part of this is that I strive to be faithful to the promises I make, and, as, I frequently find myself desiring to do well in what ever I do, persistence and conscientiousness are values that I rely on heavily. In the same perspective, I dislike inefficiency and closed-mindedness.
Another aspect to my identity is my personal attributes and interests. I perceive myself as a curious and ambitious person, and I would say that others may perceive me as slightly reserved and unusual (although I may be horribly incorrect in both.) I am quite interested in soaking up knowledge and learning about different perspectives and analysing the world around me. Skills I believe I possess are the ability to learn quickly, to see implied meaning and to investigate.
My Learning
My learning pertains to what subjects I enjoy, how I learn and my future educational goals. Although I thoroughly enjoy learning (as stated in the former paragraph), I would not be able to point to a favourite subject(s) as I find different parts interesting. For example, I like that maths is objective and speaks to relationships between numbers, however, I also appreciate the interpretation and creative factor in English. I enjoy Humanities and Science because they give me information about the world around me, including the natural world and society. Electives I undertake are French and Drama. I enjoy seeing the language and cultural differences in French (as opposed to English), and in Drama, it is exciting to embody a new character in a different world. In addition to the core subjects, I learn Religion & Philosophy, Health, Life Skills and Sport. Through the VARK Model, I would say that I learn well through Reading although I think that they are all quite balanced. Through Carl Jung’s Model of Learning, I learn in an Introverted, Intuitive, Thinking and Judging manner. (This also links to Carl Jung’s Personality Model). After high school, I wish to attend university and study law.
My Working Future
The final section of this task sums up by letting the students explore different future options, which gives them a goal to work towards with tangible steps. The occupation I chose to explore was Law, as I find the matter interesting. You can study law by obtaining a Bachelors Degree (you can do this via Juris Doctor) and after that, it is fairly common to complete a Masters Degree. The standards of entry to Law School and or assured pathways are rigorous, requiring a high ATAR and after this, a high GPA. Following this, lawyers work in private and corporate legal offices, and some work for government.
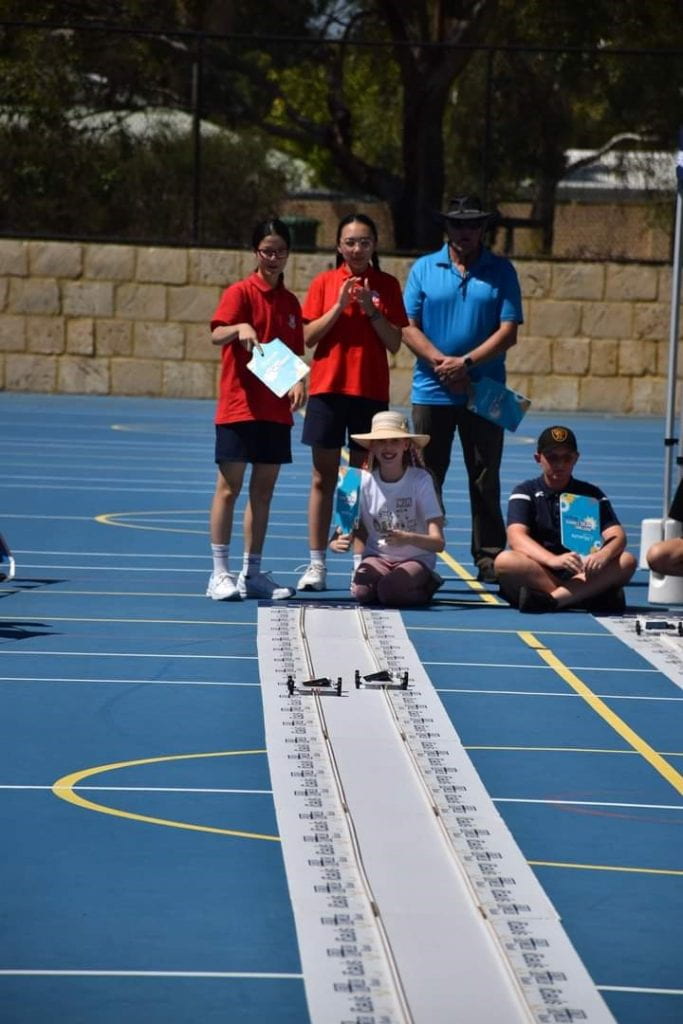
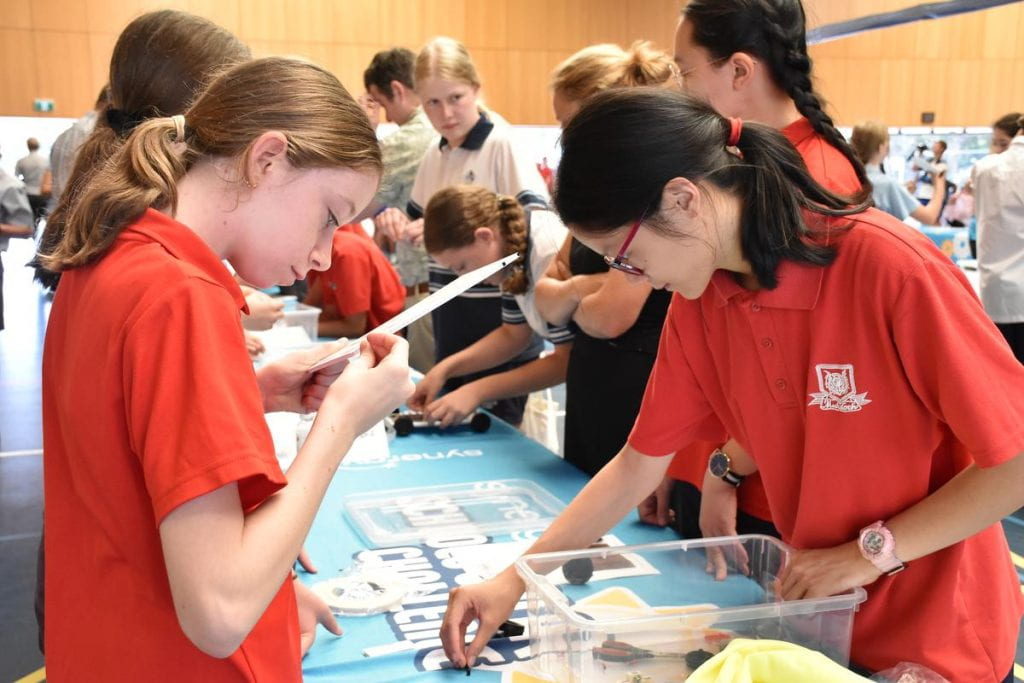
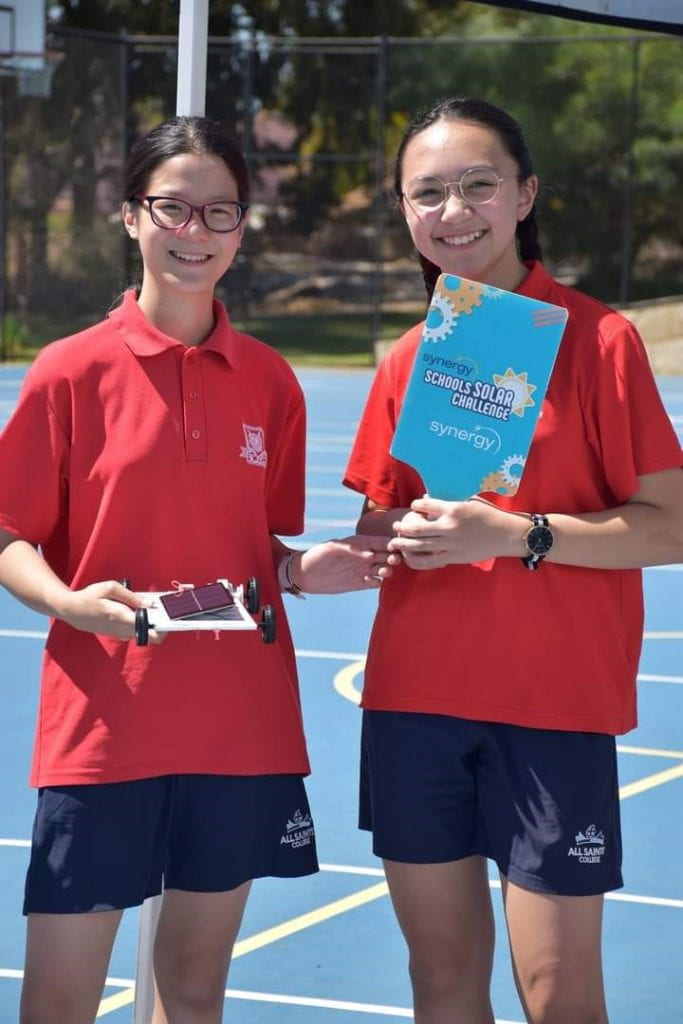
The Synergy Solar Car Challenge is a program that is designed for year six and eight students to apply STEM skills in an engaging, real-life application. As the name suggests, I and several others in our team of 4 had to build a solar car out of a corflute (a type of corrugated plastic), axles, wheels, a motor, a switch and a solar panel which was attached to the circuit with various wires. We were provided 45 minutes to do this, which included testing time.
Skills needed:
Collaboration and Teamwork:
Because we were under time pressure to build a functional car, we had to collaborate so as to build it quickly and efficiently by dividing the labour.
Problem Solving:
As mentioned above, the 45 minutes we were given was inclusive of building and testing time. During one of our trial times, the switch came apart, and through usage of problem solving skills, our team managed to solve the problem and use a working switch.
Creativity:
The track that we were to use to race on was simply a wooden pole lain horizontally on the ground. We were given a mere two pins that we could use to align the car with the pole. This proved challenging due to the shape and height of the pins.
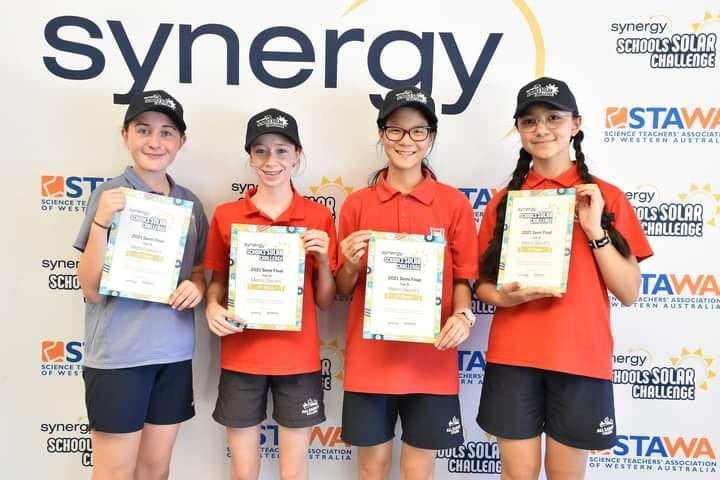
Overall, my team (All Saints’ One) finished third place.
We are researching the opinions on Maths/ STEM of students who are doing year 9 mathematics. We chose this as STEM is a field growing in size, and mathematics and STEM are now seen as more than a subject in school. The categorical question we had was “The topic in Maths I find the most enjoyable and interesting is…” and the numerical question was “In your life beyond school, how many days per week do you foresee yourself using mathematics (for work or life)?”. Some of the extra avenues for parallel data analysis that we use include by gender and by class. These results are needed to investigate what the students doing year 9 mathematics think/ do/ need/ want.
Validity and Reliability:
The non-probability sampling method used in this project was a convenience sample (non-probability sample method) which is everyone learning year nine mathematics.
This sampling method is prone to bias because the participants don’t represent a cross section of the population as all the participants are of the same/similar age group. The sample size was the 141 people, and there was sampling bias as the only people sampled were students learning year nine math. The generalization that is made is that because we only surveyed people learning year nine mathematics, this means that we can only draw conclusions and make statements about this type of people (the certain age bracket of 12-14)
The non response bias in the survey:
Question Order Bias:
People would have become tired and bored by the end of the survey (as it was very long and contained many questions)
The owner of the survey tried to avoid the problem of the questions affecting each other, but there was not anything to do to minimize/limit boredom.
Social Desirability Bias:
This wasn’t really avoided as there wasn’t anonymity of the responses and the students wanted to give the socially acceptable answer. There was apparent anonymity as names were not shared with the students, however, it was easy to see who was who, and this is obvious when viewing the results ( as the results all lined up to show a nameless profile of each student learning year nine maths. This would not be able to be avoided because in the event that the results were randomized so it didn’t show up in order for each person, we wouldn’t be able to have parallel data analysis.
There wasn’t any Yes-man phenomenon as the students didn’t know what the owner of the form would have wanted.
Ways Bias was avoided:
There were no double negatives
There was no/ limited jargon and technical language
None of the questions were leading to a specific reply
Ways Bias was included, and how to not be biased:
“What is your favourite topic in maths?” – The list of topics which could be chosen was long, and people might get bored and stop reading. This can be fixed by ordering it into rows so there would be multiple options on the same row.
There is no option for people who do not like mathematics or have another favourite do not have an option, and will therefore need a ‘other’ or/and ‘none’ option.
Sampling bias – only using year 9 mathematics students. This could have been avoided by surveying a larger range of people, such as sending the survey to the whole school. It probably could not be avoided that we only surveyed students from All Saints’ College as it would be hard to get people out of the All Saints’ community to take part in the survey.
Sample size – to get more accurate results, a larger sample size would be beneficial. This would be especially important in some places, such as when using parallel data analysis with gender, as there were not many people who were non-binary, and therefore, their views could not be represented properly.
Favourite Maths Topic
Algebra and equations
56
Functions and graphs
5
Geometry
17
Measurement
22
Probability
23
Rates, ratios and percentages
6
Statistics
12
MODE
Algebra and Equations (56)
Days of Math beyond School
MEAN
3.709219858
MEDIAN
3
MODE
7
RANGE
7
Quartile 1 – 25%
2
Quartile 2 – 50%
3
Quartile 3 – 75%
6
Quartile 4 – 100%
7
INTER-QUARTILE RANGE
4
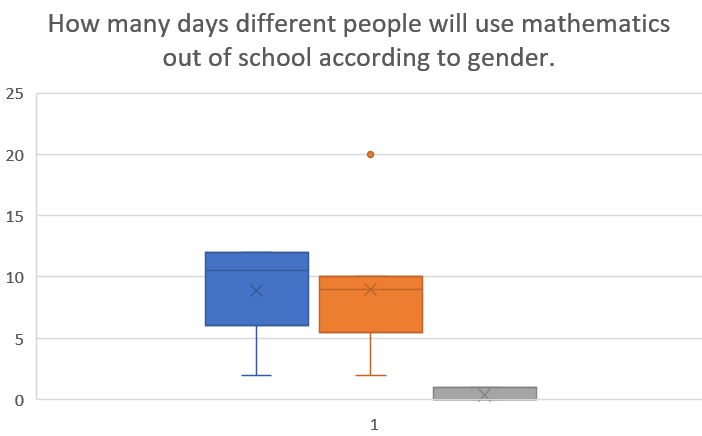
Days of Math beyond school according to gender
FEMALE
MALE
NON- BINARY
Mean
3.01515152
4.30555556
4.666667
Mode
1 and 2
7
all
Range
7
7
6
Quartile 1- 25%
1
2
3.5
Quartile 2- 50%
2.5
5
4
Quartile 3-75%
5
7
5.5
Quartile 4-100%
7
7
7
Interquartile range
4
5
2
CATEGORICAL
For the categorical question “Which topic in mathematics do you enjoy the most?”, 56 people chose algebra and equations; 23 people chose probability; 22 people chose measurement; 17 people chose geometry; 12 people chose statistics; 6 people chose rates, ratios and percentages and a mere 5 people chose functions and graphs. The mean was algebra and equations, which was 39.72% of the students who took the survey. Topics such as Functions and Graphs, Measurement, Probability, Rates, ratios and percentages and statistics are less challenging, and therefore it will be more enjoyable for the less mathematically inclined students that take Applications. Methods students find more challenging topics such as Algebra and Geometry (which are Methods students modal topics) more stimulating and exciting, therefore these are their most common favourite topics.
By Course:
Algebra: 50 Methods students and 5 Applications students chose Algebra. Not surprisingly, those in the Methods course most commonly chose Algebra as their favourite topic.
Functions and Graphs: 4 Applications and 1 Methods students chose Functions and Graphs. This could indicate that this topic is less challenging.
Geometry: 4 Applications and 13 Methods students chose Geometry as their favourite.
The Methods students seem to gravitate towards Algebra and Geometry, which may indicate that these topics are more stimulating for them, as it is more challenging.
Measurement: 11 Applications and 10 Methods students chose Measurement as their favourite. Measurement is challenging for some, but easy and enjoyable for others as seen in the results, where nearly an equal number of applications and methods students chose Measurement.
Probability:13 Applications and 10 Methods students chose Probability.
Rates, ratios and percentages: 2 Applications students and 4 Methods students.
Statistics: 6 Applications and Methods students chose Statistics. Statistics is equally popular between the 2 courses. This means that perhaps it involves less complex math, as it understandig and comprehending the data.
Topic in contrast to gender:
Algebra: 27 females, 28 males and 1 non binary.
Functions and Graphs: 2 females, 3 male and 0 non binary.
Geometry:4 female, 13 males, 0 non binary.
Measurement: 11 females, 11 males, 0 non binary.
Probability: 14 females, 9 males
Rates, ratios and percentages:3 female, 3 male, 0 non binary
Statistics: 5 females, 5 males, 2 non binary
NUMERICAL
For our numerical question “In your life beyond school, how many days per week do you foresee yourself using mathematics (for work or life)?”, 11 people said 0 days a week, 21 people said 1 day a week, 22 people said 2 days a week, 17 people said 3 days a week, 13 people said 4 days a week, 20 people said 5 days a week, 4 people said 6 days a week and 33 people said 7 days a week. The shape of the distribution was irregular – there wasn’t much of a pattern. However, when looked at with parallel data analysis using gender, we can see that females tended to choose less days a week then males. This may be because of their ideas for what they would like as a future career. A surprising feature of the results was that only 4 people chose 6 days.
The data we had from the survey allowed us to relate and understand many things about the results. Some limitations of the work, however, include the bias, especially the sampling bias as we could only find out the results from students doing year 9 mathematics at All Saints’ College. For future research in this area, it would be beneficial to survey a wider range of students, and assess the survey questions more thoroughly for bias. Overall, I enjoyed this task because I was able to learn about the opinions of students on STEM and mathematics as well as using mathematics in the research.