
Our research study involved a larger topic of gaming, involving sup-topics of console preferences, and hours of gaming per week. This also involved a variety of variations including gender and outside-of-school commitments. It is interesting due to the popularity of gaming increasing in the past. It is useful in a sense of comparisons of the consoles, and overall time spent participating in such activities in their ‘free time.
Bias and Reliability
The data presented in this information is somewhat reliable in different circumstances. There is sample bias in the numerical data in which a certain age variant is recorded (Year 9) which can hinder the results, in comparison to a larger age range. There is also a poor answer scale in the data, in which no limitation would occur, providing the data with outliers above the standard. This could be addressed/fixed by including a scale in which an answer could be provided so that there is no data that is above the able amount of hours. Another display of bias occurred in the categorical data, in which the assumption of all participants having/using a gaming console. This could be fixed by including a ‘none of the above’ option. This would allow the comparison of the people with a console vs without and would remove the assumption of obtaining a gaming console.
Our Infographic
This infographic contains the data and graphs for our research task.
Subtopics
The subtopics in which we used to elaborate in our data included gender, and if the person is more indoors or outdoors based. These both had a slight impact on the data and swayed the results overall.
Our Data
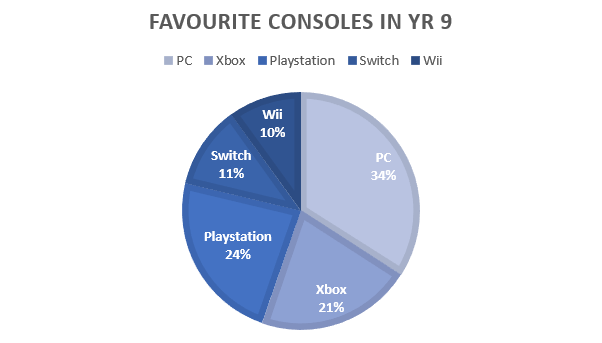
Categorical
This data was more sided towards indoors, for both boys and girls, which was not expected. 77% of the grade preferred Indoors, and from that percentage 53% of the indoors people were boys, 45% boys and the last 2% represents the non-binary’s. Gender (in regard to gaming consoles) had a moderate impact. Females were more spread out, in which the results for each console were similar. However, this did not occur for the males, as they were more distributed to the ‘PC’, in comparison to a Switch or a Wii.
Numerical
The data set was mostly skewed to the right, with high hours spent on video games spent by very few people. The range was quite high however, someone had spent 50 hours on video games a week. A good explanation for this is how dedicated students are to playing video games and how much they play them. The majority of the students spent 1 hour a week on video games, but the average time was actually 8 hours, but the median was 5 hours. There were clear outliers too; 84, 168 and 510 were very high values and seemed unreasonable to exist, so discounted them. Indoors/Outdoors (in regard to hours of gaming) had a large effect on the data. The indoors people generally spent more hours gaming per week, in comparison to outdoors people. This effect is due to their time spent inside, which can vary depending on how they describe themselves (indoors or outdoors).
Preferred area to relax by Yr 9 students
| Male | Female | Non-binary | Total | |
| Indoors | 56 | 48 | 2 | 106 |
| Outdoors | 14 | 18 | 0 | 32 |
| Total | 70 | 66 | 2 | 138 |
General
| Mean | 8.05 |
| Mode | 1 |
| Median | 5 |
| Range | 50 |
| Minimum | 0 |
| Q1 | 1 |
| Q2 | 5 |
| Q3 | 10 |
| Maximum | 50 |
| Outliers | 84, 168, 510 |
The Relationship between hours spent indoors or outdoors with the hours of time spent on video games
Indoors
| Min | 0 |
| Q1 | 2 |
| Q2 | 6.5 |
| Q3 | 14 |
| Q4 | 50 |
| Mean | 9.17 |
| Mode | 1 |
| Median | 6.5 |
| Range | 50 |
| Outliers | 84, 168 |
Outdoors
| Min | 0 |
| Q1 | 0.5 |
| Q2 | 2 |
| Q3 | 6 |
| Q4 | 20 |
| Mean | 4.33 |
| Mode | 0 |
| Median | 2 |
| Range | 20 |
| Outliers | 510 |
Conclusion
Our research task as a whole, with the resources provided allowed many different variations to our main topic which consists of ‘favourite gaming consoles’, as well as ‘time spent gaming per week’. The only realistic limitation which occurred was the availability of true data, in which bias inclusions would be disregarded, stated previously. In future, the main impact on this research was limiting subtopics, as it reduced the background information in the data, such as reasons for why such answer was selected. Overall, the experience of this project was positive, due to the freedom in which students were given, to present and use their time in which they felt was best suitable for their style.