
If you could go on a fully funded holiday anywhere i the world where would it be?
The Task
“For the remainder of Term 1, you will work in pairs to research the habits, behaviours and/or opinions of the Year 9 cohort on various topics. You will do so aided by survey data and appropriate technologies (e.g. Microsoft Excel, design and presentation software).”
“Surveys are used for a range of purposes by businesses, governments, marketing and advertising agencies and universities to research what people think, do, want or need, and are a strong tool for bringing about change.”
“You and your partner will select one topic from a list of 25 options. Your topic will include a categorical research question and a numerical research question. Your task is to use the survey data you analyse to gain interesting insights about yourself and your peers.”
Our project in our point of view
The Year 9 cohort answered a survey for us to create informative an informative poster showing our results. The question we are answering is “If you could go on a fully-funded holiday to anywhere in the world where would it be?” and How many International flights have you been on. My partner and I chose the topic travel because we thought that the results would benefit the importance of travel and how it affects personal growth.
Travel improves different lifestyles and promotes a different environment that helps to step out of the comfort zones and gives a responsible sense of who you are and what you can achieve.
The statistics
Numerical Results
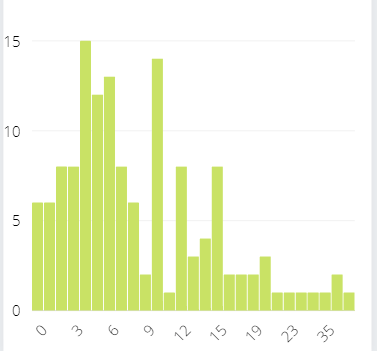
The question that was presented to us was “How many International flights have you been on?” The average is 9.489361702%, The median is seven, The mode was four. fifteen People in All Saints have been on 4 international flights throughout their life.
The statistics state that the first quartile was 4 and the second quartile (which is the median) was 7, the last Quartile (which was the 3rd) was 12.
our findings present that the range is 100 and the interquartile range is 8. In the project our outliners in the statistics were
50, 50 and 100, these are outliers due to them being way bigger than the rest of the data. The shape of distribution is skew to the right

Categorical Results
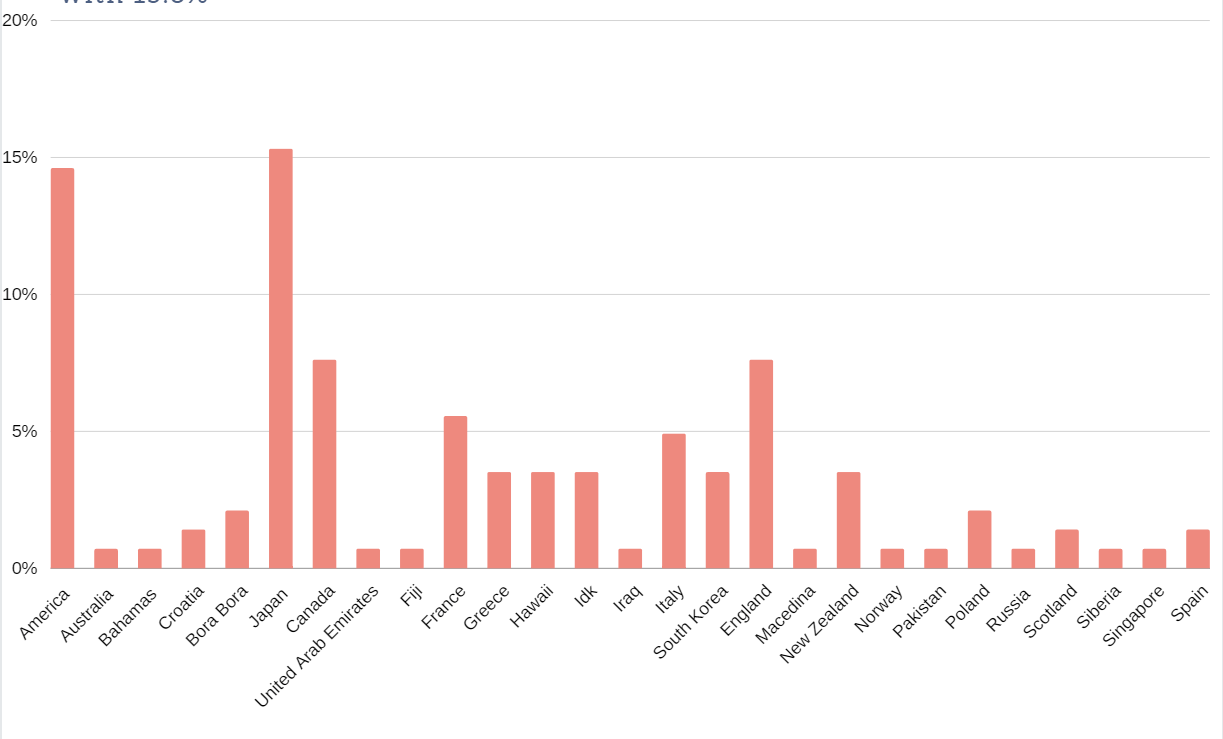
The mode of the of our results is Japan, Japan was chosen 22 times as the most likely to be travelled to by All Saints Year 9 Students.
After doing a percentage calculation we found that Japan had the highest percentage overall with 15.
8 Women choose Japan whilst 14 men also chose Japan, showing there was a clear male bias.

Explanation of results
So in summary, we found that if any year 9 student at all saints college could go on a fully-funded holiday the most people would like to go to Japan.
Surprising features
Something that surprised my partner and I was the range of different random countries that people went for because there was a huge gap between the most popular countries like Japan and America whereas places like Pakistan and Russia have 1 or 2 votes.
Concluding research
Throughout the research process, we experience many different limitations that had to be solved in order to get our final project, some of these limitations include:
Not understanding some of the terms we had to find, for instance, neither of us had very much experience in Excel which made it alot harder
Upon starting the research process we weren’t very creative so we changed ideas multiple times changing from a Powerpoint to a Powtoon until we came to the final decision, a Canva poster.
The overall experience of researching all this was very enjoyable and a great learning experience which will be a huge benefit towards our future.