We chose this topic because as we are all grounded in Perth due to COVID we decided that it would be interesting to learn about our peer’s view on travel. This would also give us a different perspective of our peers, giving us an idea of people’s plans for traveling and how many people have been to different areas of their world.
•Sampling basically means selecting people from a population in order to test the population for something. Our Sampling, to receive information on people’s background and travel was Year 9’s (and extension year 8’s) that attend All Saints’ College. The type of Sampling was convenient sampling. The reliability of this sampling method may have been effected this is because people may have been influenced by their peers to their answers as the forms was answered in class. The forms survey took a long time and this could affect the results people wrote as they may have wanted to get the survey over and done with not giving us an accurate result. The sample size was quite decent however we can only assume that the results apply to only All saints’ college year 9 students.
A Bias was present was the fact that we go to a private school and the results will be different between private and public schools since All Saints’ is a private school and this affects the results in how many holidays people have visited. This is because we can assume that people of private school are wealthier than students of public schools. Another possible bias is that we surveyed year 9’s, so when we display this data they we must apply this data for year 9 students at All saints’. Another possible bias is the factor of people lying.
Box Plots
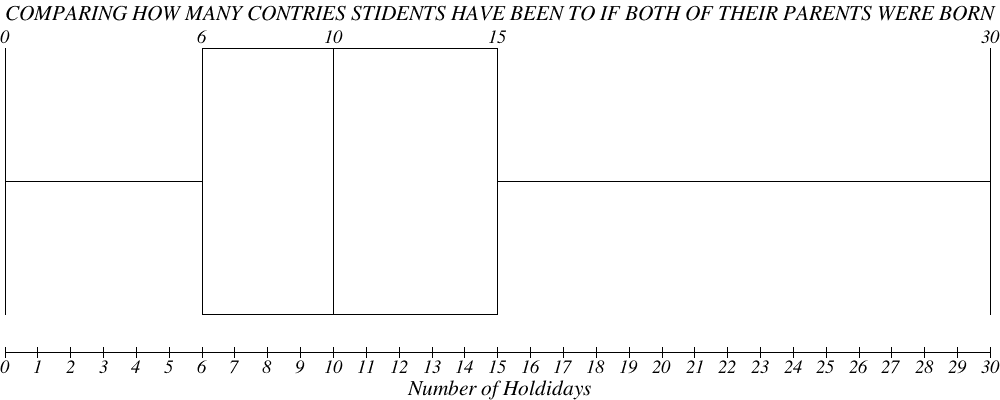
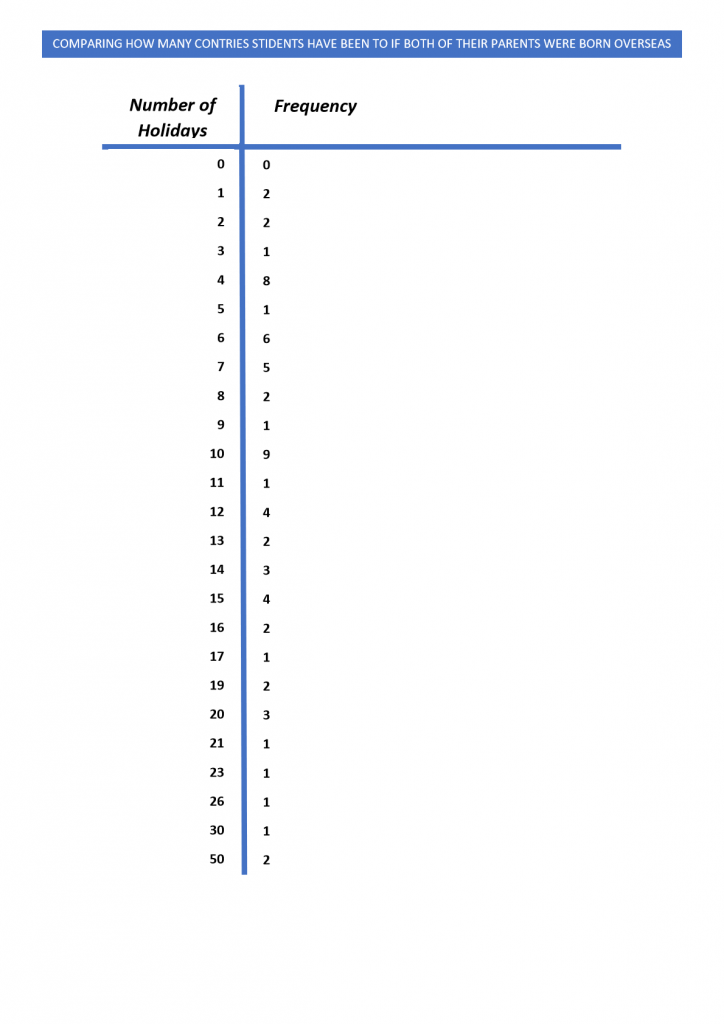
If both parents are born overseas 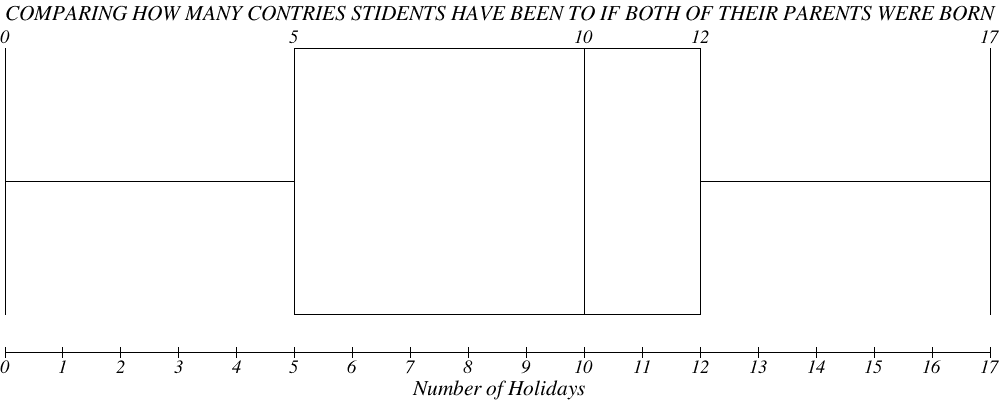
If one parent is born overseas 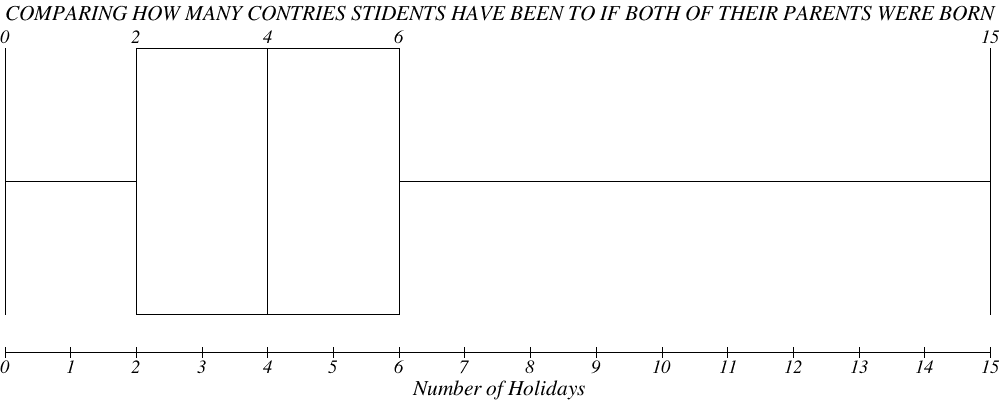
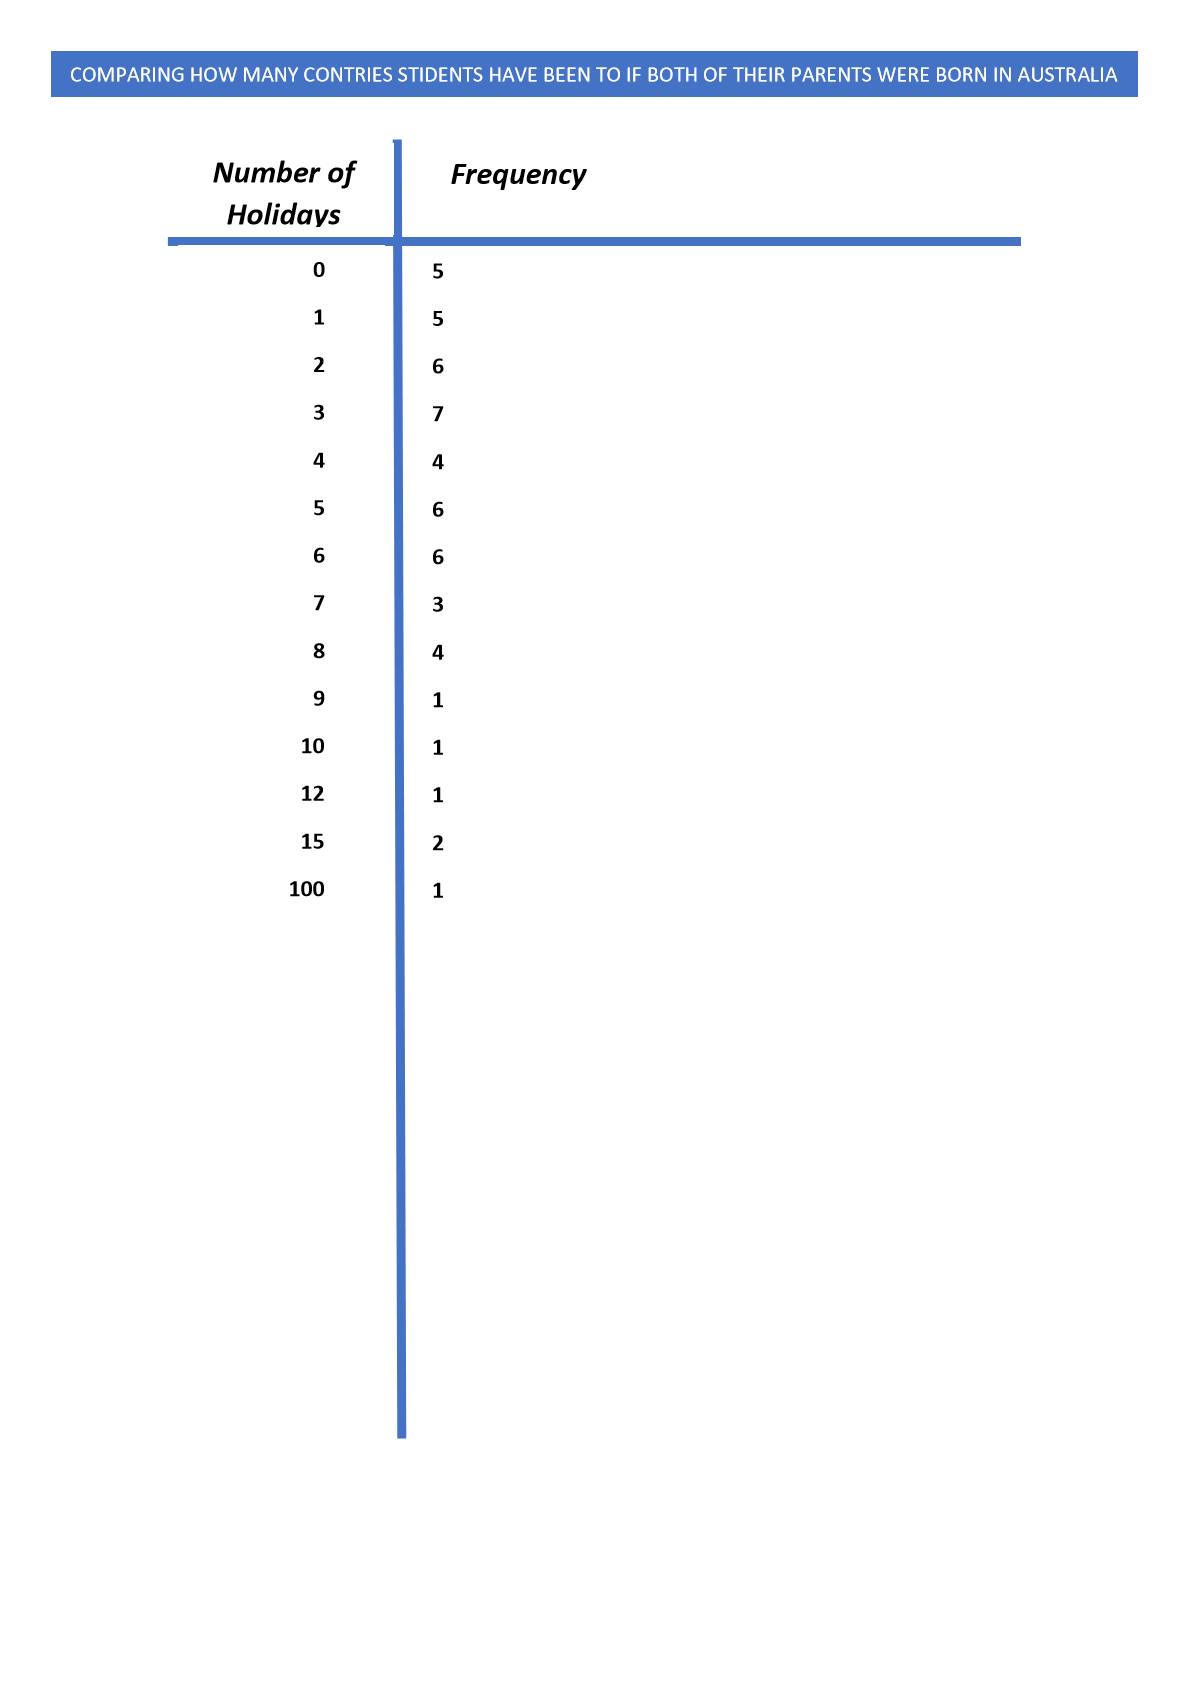
If both parents are born in Australia
Frequency Tables

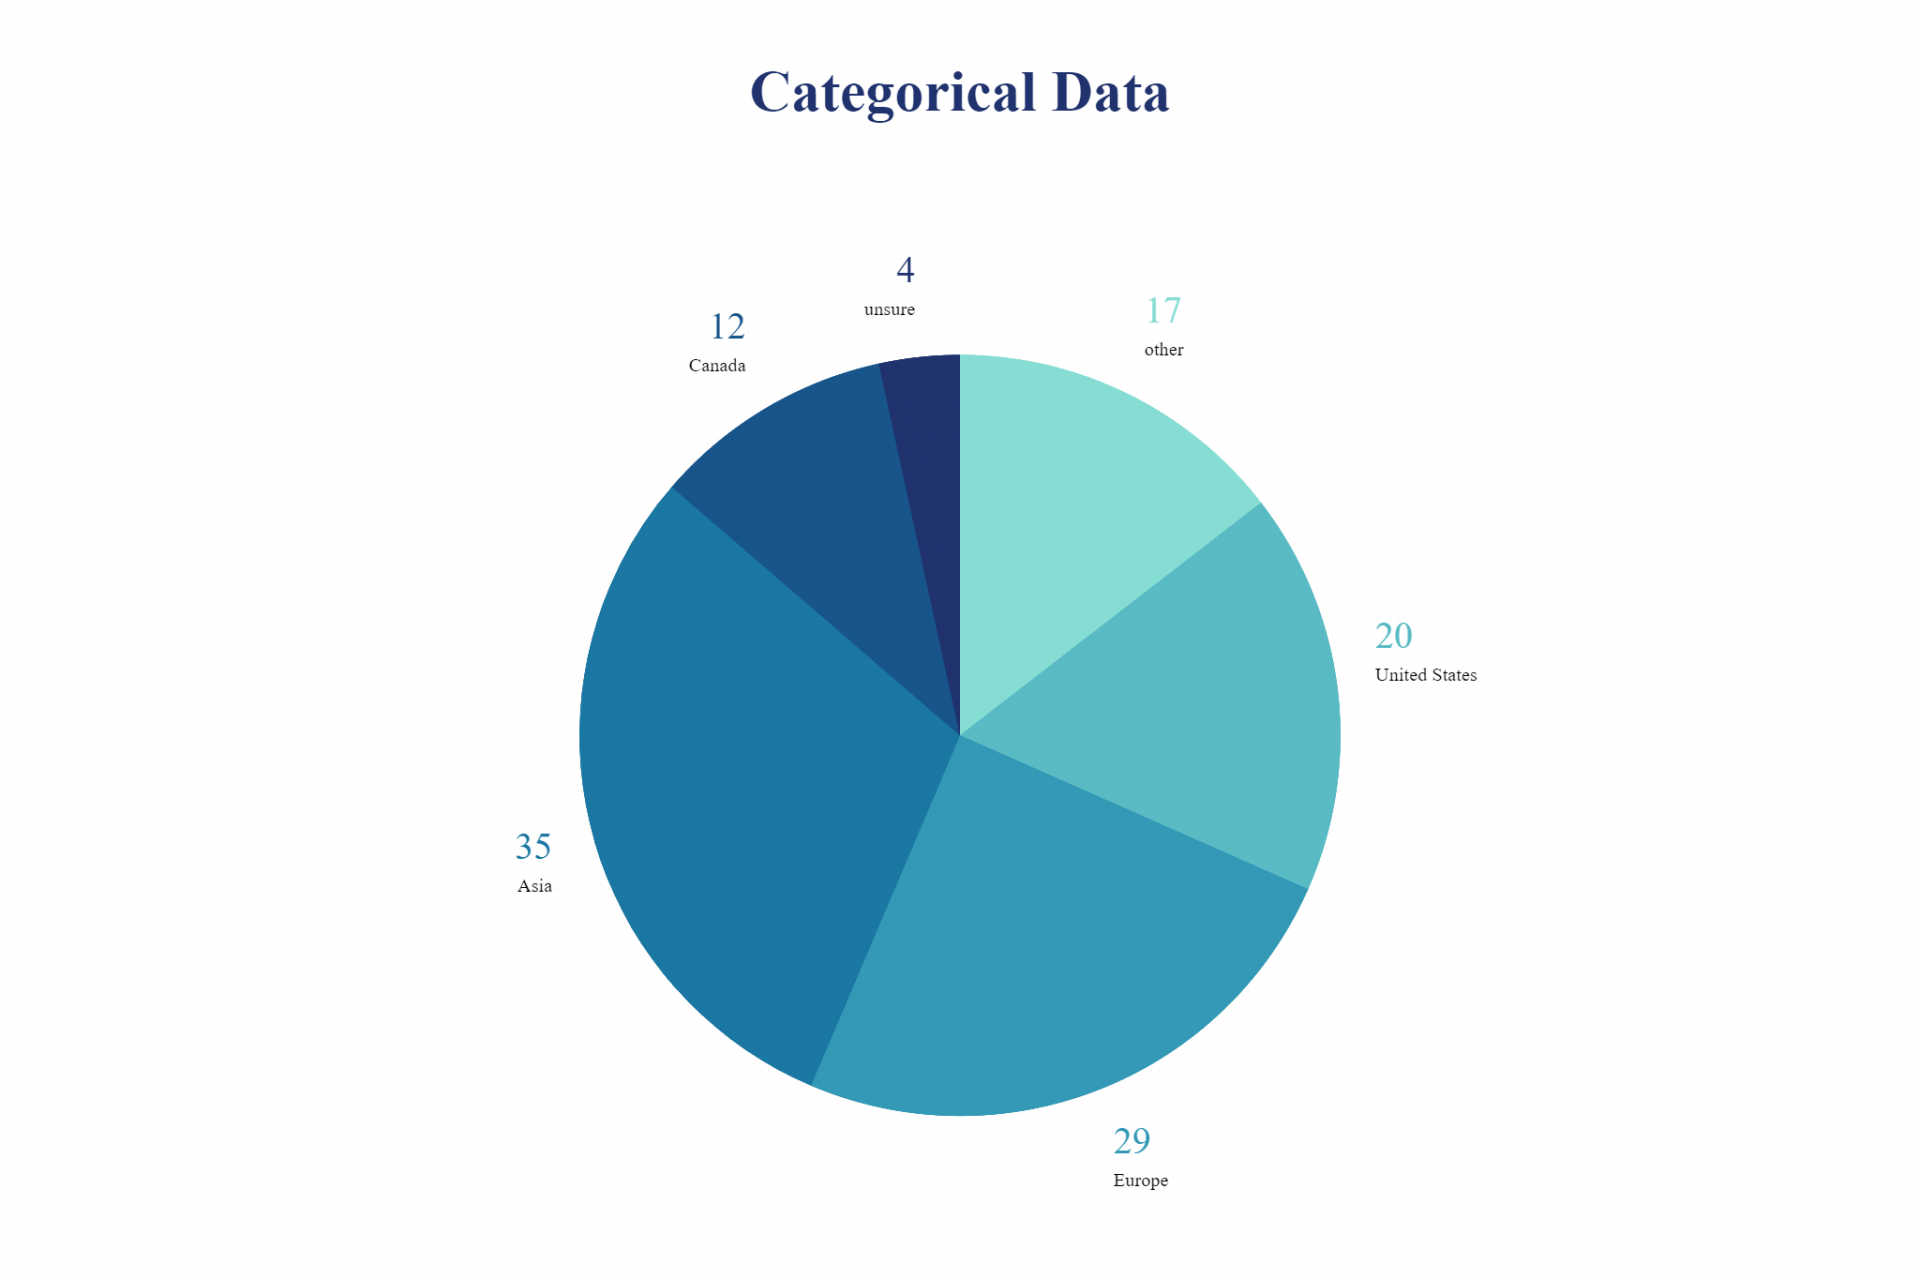
Catagorical Data