SEB AND KEN DATA RESULTS
These results were taken on a Microsoft Forms sheet on a year 9 cohort at All Saint’s College (a private school). There will be a sheet at the bottom of the page showing the Raw data for the 2 questions we analyzed at the bottom of the page on the digital copy, if this is the physical copy, there will be a raw data sheet stapled to the back of the sheets.
These were the questions we analysed
Q1: Out of the following consoles, which is your favorite?
- PC
- Wii
- Switch
- PlayStation (PS)
- Xbox
Q2: In a typical week, for how many hours do you play videogames on a Phone/Console/Computer?
(Text Response)
Questions statement
For each Question, there will be a different average/percentage for each gender (Male, Female, Non-Binary) and an average/percentage overall. The title at the top of the page will state which of these it is. The table at the end shows the whole result and the centred titles will say which result I am talking about for each paragraph.
DATA
Overall
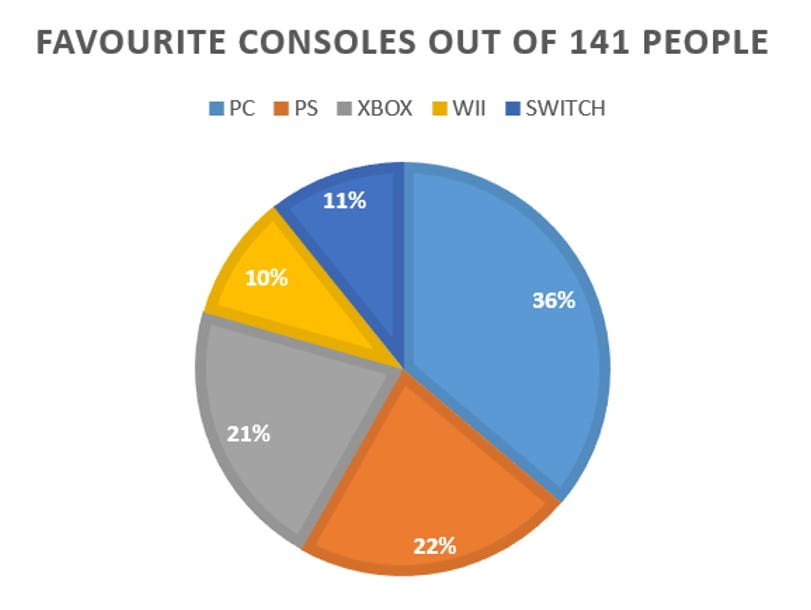
As you can see, majority of people overall preferred gaming with a PC, with 51 out of 141 people voting for it. Wii had the lowest, with 14 out of 141 people voting for it. There were no answers for this subject (going for each gender and overall) because it was a multiple choice Q/A.
Females
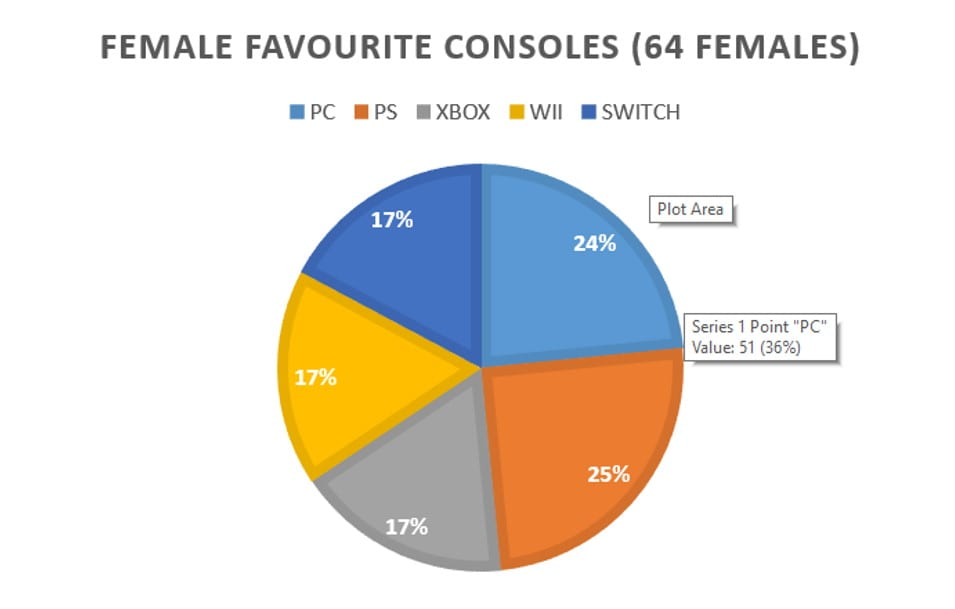
Females preferred the PlayStation overall with 25% or 16 people voting for it. PC fell 1 vote behind with 24% or 15 people voting for it and it was a three-way tie in last between Xbox, Nintendo Switch, and the Wii all coming in at 17% or 11 votes for each one.
Males
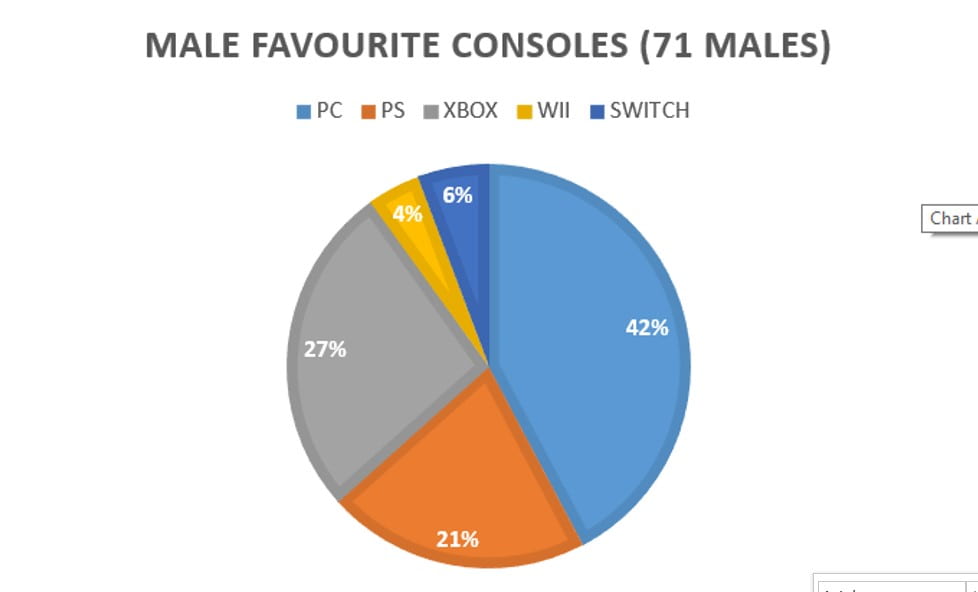
In the male’s case, 42% or 30 out of 71 males voted for PC, which had the most votes. Coming last with only 3 votes was Wii at 4%. Interesting but predictable results for the males.
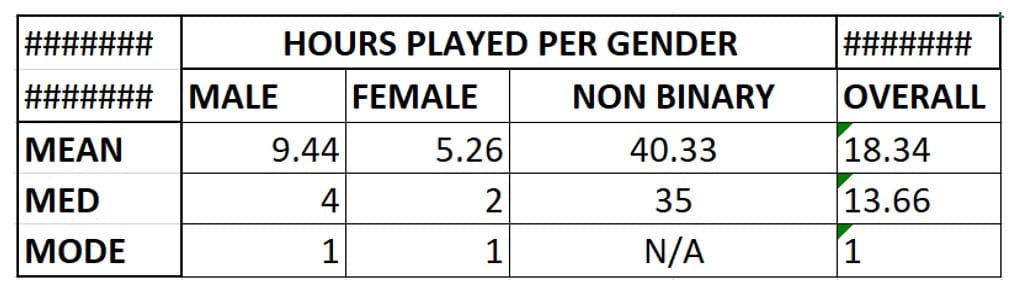
Number of hours (of videogames) played per week
Outliers
There were 2 outliers in the male result for the amount of hours played per week, one being 168 hours, meaning that they would be playing a game every single second of the 24 hours there are in a day, and one being 510 hours, and there aren’t even 510 hours in a week. These were the outliers which brought the male average up.
Range
The data range was a surprising 510, this range included the outliers. Without the outliers, the range was 84 hours, which is still a lot. This ranged from 0 hours to 84 hours.
Quartiles
The 1st quartile’s value was 1, and the 3rd quartile’s range was 14.
Mean
Overall, the true average, or mean, was 18.34 hours a week, which is about 2.6 hours a day on average. For the mean, the females had the least number of hours a week on average, only 5.26, or about ¾ of an hour each day of the week. Males were 2nd with an average of 9.44 hours a week, or around 90 minutes of videogames a day. Non-binaries had 40.33 hours of videogames a week, or 5 ¾ hours a day.
Median
The median was drastically different, females still with the least, 2 hours a week being the middle, males having 4 hours a week in the middle, and Non-binaries having 35 hours a week as the average (still 5 hours a day).
Mode
The mode was yet again drastically different, 1 hour a week being the most common answer to the question for males and females. Non-binary results were non-applicable because there were no answers the same.
RAW DATA
This is the Excel spreadsheet containing the raw data for the results we analyzed