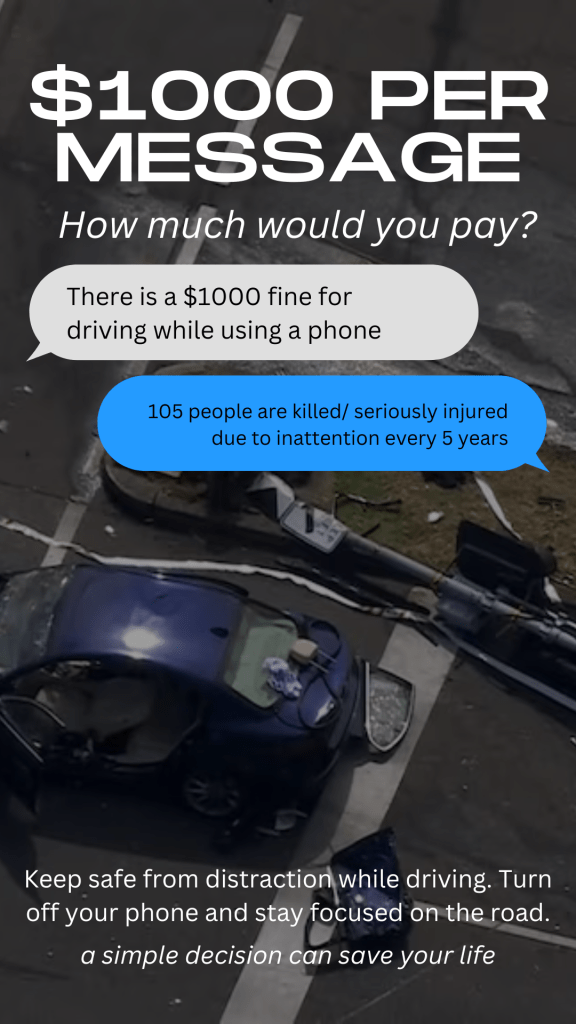
What one piece of advice would you pass on to young drivers above all else?Why?
Always remain fully concentrated on everything on the road.
I would pass this on as it is key to staying safe on the road – without giving your full attention, driving safely is a gamble for you and those around you, and you can’t tell what you need to do. Although this might seem obvious, it is easy for people to neglect as they can be easily distracted, such as by devices or other people in the car. These sorts of things lead people to become complacent, which results in the lack of attention that causes people to end up in accidents.
People need to make sure their full focus is on the road, rather than allowing distractions such as devices or other people who are in the car, as you could never know if you do something wrong or don’t notice anything, or if someone else does something wrong and you can’t keep yourself safe.
Write down a pledge that you will commit to when you start driving.Why did you pick these things to commit to? How will you stick to these commitments?
I pledge to be fully focused while driving and to stay free from all distractions, in ways such as keeping my phone off, and not engaging in conversation with passengers.
I picked these things to commit to as distraction can largely increase the risk of a crash, and is also one of the easiest things to avoid. This means that I can easily stay much safer by a simple choice, despite the fact that others may not always do this, simply for their own entertainment or lack of self control. Staying free from distraction when driving is something many people may neglect to do properly, but can have a large impact on safety while driving, so by taking simple steps, I can effectively minimise my risks.
I will stick to these commitments by making sure all distractions are away while driving. I will make sure my phone is off before I drive, in both silent and do not disturb mode, and also keep it out of my own reach, such as in the back seat, so that even a lack of self control cannot lead me to use it and thus increase risk. I will also avoid engaging in conversation while driving, so that I can stay fully focused on the road without other people to think about. I can do this by asking any passengers not to converse with me, especially on crowded roads, or if necessary only giving short answers to avoid a continued conversation.
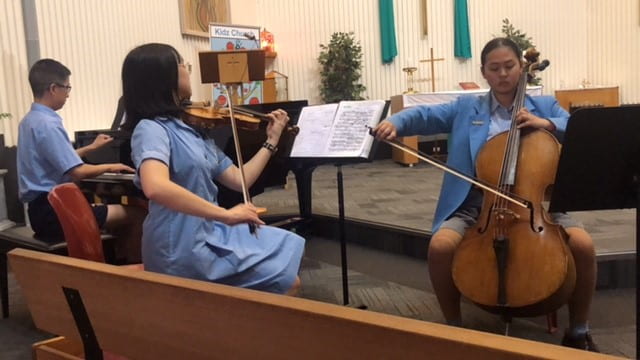
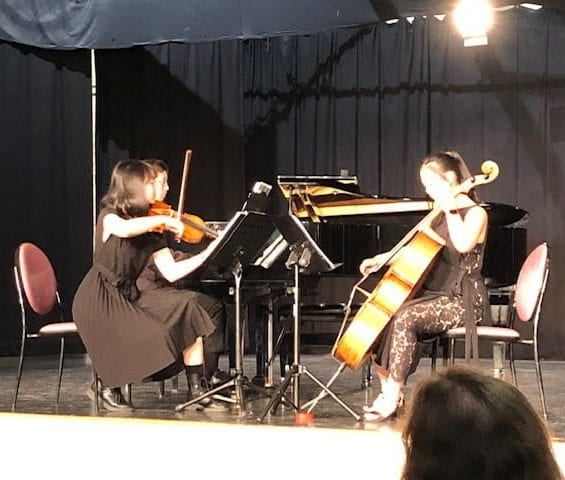
This year, I formed a piano trio with some friends of mine, playing in which has improved my skills in leadership and teamwork.
In chamber music, everyone works together to create the same piece of music. This requires everyone to understand and view the piece together, in the same way, in order to have a proper and unified interpretation of the piece for a good performance. This requires us to communicate, both through playing the music and in words to formulate ideas and work to shape the piece as we think it should be. In rehearsals, we discuss how we want the piece to sound, how we want to play each part, what story it should be telling, et cetera. This communication is an essential part of chamber music, demonstrating the teamwork that playing it well and properly requires.
Chamber music also has a large component of leadership to it. This is especially significant in a piano trio, in which the musicians are like three soloists, due to the nature of the group, compared to, say, a quartet, in which everyone strives more to play like one person. This nature of the trio means that each of us are required to be like soloists – to act as leaders. As we play our part, we are individuals, and, when each person has an important part, they are required to play the part of a leader, showing how the section should sound and guiding it. As we rehearse, we also have to take on the role of leaders, by each giving ideas or feedback on how we played the piece, all of us contributing as though all leading each other.
Playing in a trio, we all exhibit teamwork and leadership in order to play a shared interpretation of the piece and to contribute and lead with our ideas.
In Health class, we researched a wellbeing issue in groups and presented the information at and expo station, displaying it to other classes to raise awareness. My group used posters, a video and a Kahoot to promote and teach about the issue of the excessive use of social media.
What were the biggest things you learnt while completing this task?
Some of the biggest things I learnt while completing this task was about the variety of unique dangers that social media can cause (such as increased risk of mental illness, feelings of inadequacy, fear of missing out, isolation, cyberbullying, self absorption and lessened connection with the world), and why. The task allowed me to gain a deeper understanding on why this was an issue and what the base causes of it being an issue was, therefore helping more for avoiding the issue due to the understanding. One of these things was about how everything tied into each other. When using social media, even though we know something may be fake, we are still affected by them. This gives us the fear of missing out, which can impact self esteem, leading to anxiety and therefore more use, fuelling addiction. This is just one of the many ways things tie together, which can inform us about how we need to try harder to avoid these issues, as they can lead on to many others.
What one piece of advice would you pass on to young people with regards to wellbeing above all else? Why?
One piece of advice I would pass on to young people in regards to wellbeing is to take preventative action against things to avoid addiction, such as to social media, before it is too late.
This is because it is much easier to prevent things than to stop something already in action, so while people are not addicted they need to make sure to avoid it for this to be easier in the long run. Due to all the issues this can cause, and how they can easily cause and add onto each other, it is much more difficult to stop than to prevent, and this is also important to avoid issues overall, instead of having to experience them to know to stop.
Write down a pledge that you will commit to in regards to your own wellbeing. Why did you pick these things to commit to? How will you stick to these commitments?
I pledge to commit to limiting distractions of social media. This is so that I do not become too attached to it and it does not affect other areas of my life. I will stick to this by limiting time, leaving distractions away when I have something else to do or that I can do, and keeping notice of what I am doing, rather than letting it become a usual mindless activity.
We are researching the opinions on Maths/ STEM of students who are doing year 9 mathematics. We chose this as STEM is a field growing in size, and mathematics and STEM are now seen as more than a subject in school. The categorical question we had was “The topic in Maths I find the most enjoyable and interesting is…” and the numerical question was “In your life beyond school, how many days per week do you foresee yourself using mathematics (for work or life)?”. Some of the extra avenues for parallel data analysis that we use include by gender and by class. These results are needed to investigate what the students doing year 9 mathematics think/ do/ need/ want.
Validity and Reliability:
The non-probability sampling method used in this project was a convenience sample (non-probability sample method) which is everyone learning year nine mathematics.
This sampling method is prone to bias because the participants don’t represent a cross section of the population as all the participants are of the same/similar age group. The sample size was the 141 people, and there was sampling bias as the only people sampled were students learning year nine math. The generalization that is made is that because we only surveyed people learning year nine mathematics, this means that we can only draw conclusions and make statements about this type of people (the certain age bracket of 12-14)
The non response bias in the survey:
Question Order Bias:
People would have become tired and bored by the end of the survey (as it was very long and contained many questions)
The owner of the survey tried to avoid the problem of the questions affecting each other, but there was not anything to do to minimize/limit boredom.
Social Desirability Bias:
This wasn’t really avoided as there wasn’t anonymity of the responses and the students wanted to give the socially acceptable answer. There was apparent anonymity as names were not shared with the students, however, it was easy to see who was who, and this is obvious when viewing the results ( as the results all lined up to show a nameless profile of each student learning year nine maths. This would not be able to be avoided because in the event that the results were randomized so it didn’t show up in order for each person, we wouldn’t be able to have parallel data analysis.
There wasn’t any Yes-man phenomenon as the students didn’t know what the owner of the form would have wanted.
Ways Bias was avoided:
There were no double negatives
There was no/ limited jargon and technical language
None of the questions were leading to a specific reply
Ways Bias was included, and how to not be biased:
“What is your favourite topic in maths?” – The list of topics which could be chosen was long, and people might get bored and stop reading. This can be fixed by ordering it into rows so there would be multiple options on the same row.
There is no option for people who do not like mathematics or have another favourite do not have an option, and will therefore need a ‘other’ or/and ‘none’ option.
Sampling bias – only using year 9 mathematics students. This could have been avoided by surveying a larger range of people, such as sending the survey to the whole school. It probably could not be avoided that we only surveyed students from All Saints’ College as it would be hard to get people out of the All Saints’ community to take part in the survey.
Sample size – to get more accurate results, a larger sample size would be beneficial. This would be especially important in some places, such as when using parallel data analysis with gender, as there were not many people who were non-binary, and therefore, their views could not be represented properly.
CATEGORICAL
For the categorical question “Which topic in mathematics do you enjoy the most?”, 56 people chose algebra and equations; 23 people chose probability; 22 people chose measurement; 17 people chose geometry; 12 people chose statistics; 6 people chose rates, ratios and percentages and a mere 5 people chose functions and graphs. The mean was algebra and equations, which was 39.72% of the students who took the survey. Topics such as Functions and Graphs, Measurement, Probability, Rates, ratios and percentages and statistics are less challenging, and therefore it will be more enjoyable for the less mathematically inclined students that take Applications. Methods students find more challenging topics such as Algebra and Geometry (which are Methods students modal topics) more stimulating and exciting, therefore these are their most common favourite topics. Females
By Course:
Algebra: 50 Methods students and 5 Applications students chose Algebra. Not surprisingly, those in the Methods course most commonly chose Algebra as their favourite topic.
Functions and Graphs: 4 Applications and 1 Methods students chose Functions and Graphs. This could indicate that this topic is less challenging.
Geometry: 4 Applications and 13 Methods students chose Geometry as their favourite.
The Methods students seem to gravitate towards Algebra and Geometry, which may indicate that these topics are more stimulating for them, as it is more challenging.
Measurement: 11 Applications and 10 Methods students chose Measurement as their favourite. Measurement is challenging for some, but easy and enjoyable for others as seen in the results, where nearly an equal number of applications and methods students chose Measurement.
Probability: 13 Applications and 10 Methods students chose Probability.
Rates, ratios and percentages: 2 Applications students and 4 Methods students.
Statistics: 6 Applications and Methods students chose Statistics. Statistics is equally popular between the 2 courses. This means that perhaps it involves less complex math, as it understandig and comprehending the data.
TOPIC IN CONTRAST TO GENDER:
Algebra: 27 females, 28 males and 1 non binary.
Functions and Graphs: 2 females, 3 male and 0 non binary.
Geometry: 4 female, 13 males, 0 non binary.
Measurement: 11 females, 11 males, 0 non binary.
Probability: 14 females, 9 males
Rates, ratios and percentages: 3 female, 3 male, 0 non binary
Statistics: 5 females, 5 males, 2 non binary
Algebra and equations
56
Functions and graphs
5
Geometry
17
Measurement
22
Probability
23
Rates, ratios and percentages
6
Statistics
12
MODE
Algebra and Equations (56)
NUMERICAL
For our numerical question “In your life beyond school, how many days per week do you foresee yourself using mathematics (for work or life)?”, 11 people said 0 days a week, 21 people said 1 day a week, 22 people said 2 days a week, 17 people said 3 days a week, 13 people said 4 days a week, 20 people said 5 days a week, 4 people said 6 days a week and 33 people said 7 days a week. The shape of the distribution was irregular – there wasn’t much of a pattern. However, when looked at with parallel data analysis using gender, we can see that females tended to choose less days a week then males. This may be because of their ideas for what they would like as a future career. A surprising feature of the results was that only 4 people chose 6 days.
The data we had from the survey allowed us to relate and understand many things about the results. Some limitations of the work, however, include the bias, especially the sampling bias as we could only find out the results from students doing year 9 mathematics at All Saints’ College. For future research in this area, it would be beneficial to survey a wider range of students, and assess the survey questions more thoroughly for bias. Overall, I enjoyed this task because I was able to learn about the opinions of students on STEM and mathematics as well as using mathematics in the research.