In term 1 the individuals of the math classes in year 9 have been set a task to collect data and information on a topic provided. Emily and I have been given the topic, Music. To gain the best data we possibly could we did two surveys. The first survey was created by the staff of the college and all the members in year 9 participated. The second survey was created by Emily and me and only the members of Ms. Mast Year 9 maths class took part.
“Music is life itself” – Louis Armstrong. Music, Everyone has heard of it and almost everyone uses it. Music means many different things to many different people. Studies show that 68% of people globally listen to music every year. The aim of our surveys was to see how music affects peoples day to day life.
Year 9 math Cohort survey:
The year 9 maths cohort filled out a survey that had many different questions on many different topics. That data was then used for different pairs based on what their topic was. Around 141 people took this survey. The questions that were asked were, what app do you listen to music on, do you find it helpful to listen to music while doing homework and how many hours a day do you listen to music? Because the sample size was not very large the results only reflect the year 9 students thoughts and beliefs who participated in the survey.
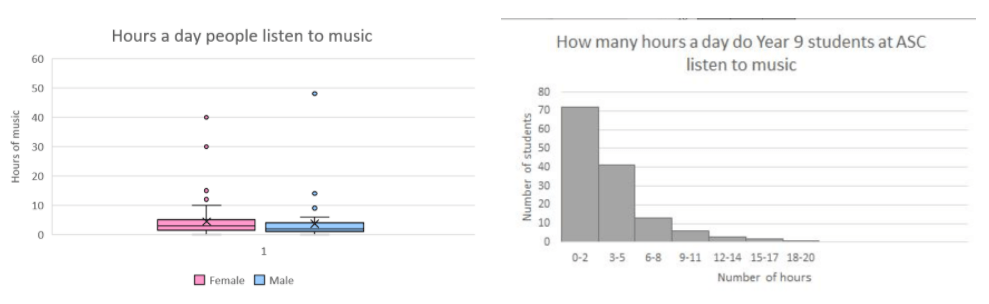
How many hours a day does an individual listen to music.
This histogram and box and whisker plot above show the number of hours that an individual listens to music each day. 124 people participated in answering this question. 72 people voted for listening to music between 0 to 2 hours a day, which is 58% of people. Interestingly music is a huge part of many people’s lives with 21 people listening to music between 6 to 14 hours.
There were a few outliers within this chart, someone said they listen to music for 40 to 42 hours a day which just can’t be possible so we removed it from our data. Without the outliers, both the box and whisker plots for males and females are almost symmetrical. The mean of the average for our data was 9 hours but once we took out the outliers the average was 6 hours meaning on average that is how long an individual in the year 9 cohort listens to music for. The rage for this data was 48 which shows that there was a very big difference between the most voted hours and the least voted hours. Interestingly the middle 50% of people in both males and females in the box and whisker plots are similar or almost symmetrical. Both the median and mode were 0-2 hours, this was the most common answer.
An interesting feature of the histogram is that it is able to show us that as the hours got longer the number of people who voted for them got less. These graphs are able to show a great visual representation of the data, it can clearly show and identity and outliers. The data was able to tell us that many people listen to music for a number of hours each day.
———————————————————————————————————————————
This bar graph above shows how helpful an individual finds it when listening to music while doing homework. They had the options of picking from, always, sometimes, rarely, and never. 141 people took the survey. For each gender “Always” we the highest voted which Is the mode. This shows that the majority of people find that listening to music while doing homework is helpful. Interestingly, more women always find it helpful to listen to music compared to men.
59% of women chose “always” compared to 44% of men. This may be because women find it more helpful to get more work done when they have background noise e.g., music. This may also support the stereotype of women being more creative and enjoy listening to music compared to men.
An Interesting feature in this graph is that it is positively skewed. As the frequency of listening to music while doing homework gets less rare so do the votes for that option.
———————————————————————————————————————————
The interactive pictograph above shows a visual and interactive demonstration of the responses we received on the question, whats your most preferred way to listen to music? Research has shown that 138 million people use Spotify each year. As you can see by looking at the graph Spotify is very popular in the year 9 maths cohort. 77% of people who answered this question picked Spotify. The reasoning for this may be because Spotify can be a free-to-use app that has many features therefore it very accessible to many.
An interesting feature about this pictograph is that Spotify has outnumbered the other apps and services by a lot, this is a lot different from other graphs because there are usually at least two options with a similar amount of votes. This means that Spotify is used a lot more compared to YouTube or Apple music.
———————————————————————————————————————————
Ms. Mast year 9 class survey:
20 members of Ms. Mast’s year 9 maths class participated in a survey that asked multiple questions on the topic of music. The questions were, your gender, do you listen to music for more than 1h a day, and do you get more work done when you listen to music. This survey was slightly biased because it was not confidential meaning that we could see who said what, this then leads people to not answer truthfully because they may be scared what they think is different from what others think. The sample size was very small in this survey so the results only reflect on the students of Ms Mast year 9 math class.
——————————————————————————————————————————–
The two pie charts above display the results to the question, do you listen to music for more than 1 hour a day. Pie charts are a great way to share data visually without much wording involved. 12 females and 8 males answered this question. responses ranged from 3 to 12.
Interestingly, 100% of the females responded with yes, this indicates that women are more likely to enjoy listening to music compared to men. 62.5% of men responded with yes and the other 37.5% responded with no, furthermore this helps to support the idea that not all men find enjoyment in listening to music.
Overall these pie charts visibly show that women are more likely to listen to over 1 hour of music a day compared to men.
——————————————————————————————————————————–
This bar graph above demonstrates the results of 20 responses, When you listen to music do you get more work done? 12 females participated in the survey and 8 males. Participants of the survey had the option of picking from yes or no. 83.33% of females said yes compared to 62.5% of males. This may suggest that males find it distracting to listen to music while completing work.
Interestingly even though there was a fewer amount of males that took this survey majority of them still chose “no” as an answer. This further proves my theory that males don’t enjoy listening to music while doing work. 75% percent of participants that took this survey believed that they get more work done while listening to music.
This graph upholds the thoughts of women finding that listening to music improves the efficiency with which they work at. People who answered yes to this question were then asked why that is, many people said things like, “it blocks out distracting sounds”, “it helps me concentrate” and “it makes me more motivated to do work”.
———————————————————————————————————————————
conclusion:
Overall all these surveys were able to demonstrate the fact that music plays a huge role in the lives of Year 9 students. There were a few limitations within the surveys because the sampling size wasn’t very large, therefore meaning this data cannot be used globally or for anyone outside the ages of Year 9 students (14 & 15). The data also supports the idea of women finding it beneficial to them to listen to music while doing daily tasks like schoolwork. 100% of people in the Year 9 cohort like to experience art through music. Studies have proven that music improves things like an individual’s mood and how they feel.