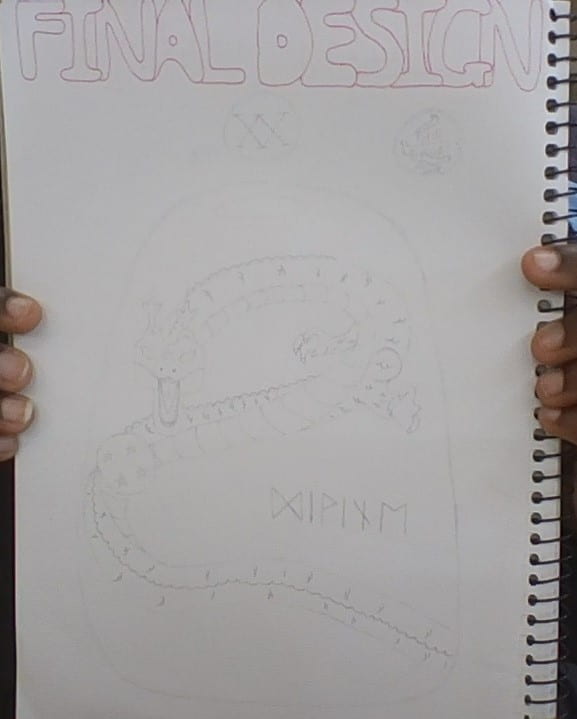
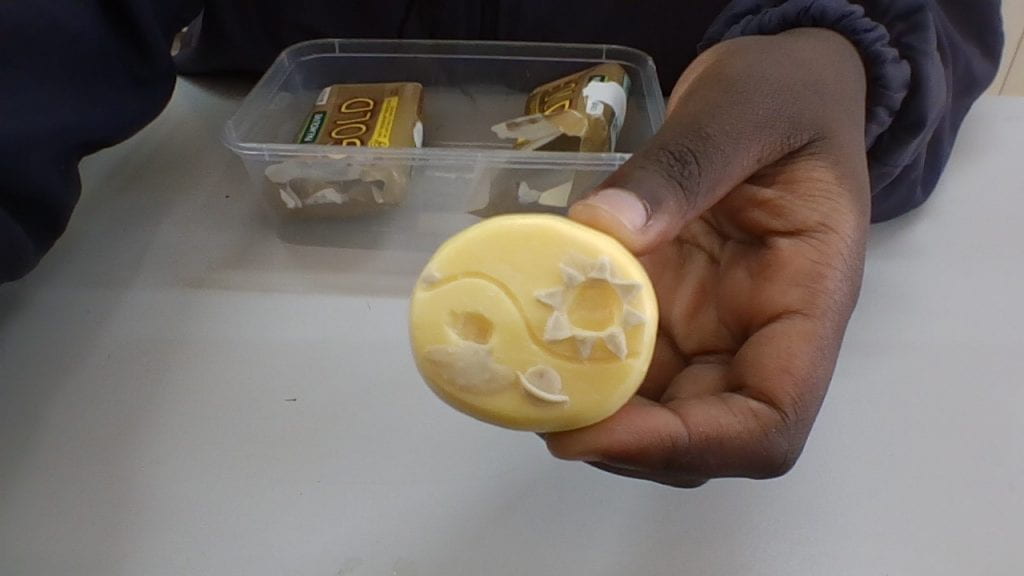
Throughout this project I failed to meet targets I had set for myself. From the beginning I was behind where I should have been and never managed to fully catch up. This resulted in me having to change my final design because of its complexity and my poor time management. I originally planned to make a green amulet inspired by the anime Dragonball, the design featured references like the 5-star ball and Shenron. The original design would have had a glossy almost transparent look and been lime green. The design was supposed to resemble a glass/crystal look. However, I did end up changing my design to something simpler and more basic. The final design was based off the yin and yang design mixed with the contrast of the sun and moon. The finish was a mixture of blue and gold to compliment the red of the crystals. I used a blue for the base and gold for the face. On the top I dry brushed the blue pain to add a filter to the gold. Around the base I used gold glitter on the blue.
Original design Final design
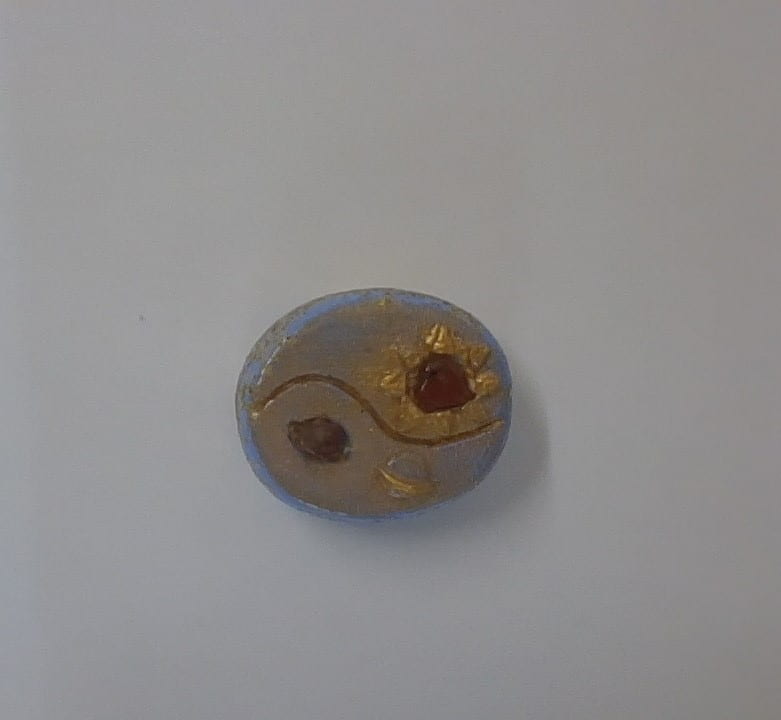
Something that didn’t work was the glitter around the base. I wanted the gold to be like a dust on the blue and to be on look. I trialled different techniques to achieve this such as, mixing the gold glitter into the blue paint first and then painting it on, using powder to make the paint more translucent so the glitter would show, and finally using different ratios of mixing. None of these methods proved successful and I eventually settled on painting a base coat and then patting the glitter of the top. Something that worked relatively well was dry brushing the blue over the gold. This project was the first time I had attempted something like this, and it came out decent which was good. It didn’t give the glossy look I had hoped for, but it still added the resemblance of a filter. Once I was finished I sprayed my amulet with a gloss to give it a shine and set the glitter.
Final look after gloss
I think my amulet was both a failure and success. In comparison to my original design, I think I failed significantly, because of how different the two are. However, by itself I think I did pretty well in terms of adapting, finishing, and putting something together.
The biggest things I learnt from this campaign were that sleep is very important for our brains and how we react to potential hazards, and having a consistent sleep routine can heavily benefit the way we function.
My Advice
One piece of advice I would pass on to young drivers above all else is that; staying up all night is not cool & sleep is a very important benefactor for our heal/wellbeing. Many young people view staying up late as fun & do not understand the damage it does to their minds & the effects it has on their development.
My Pledge
I, Tunmise Aniyi, pledge to never drive fatigued & put myself as well as the people around me (i.e. passengers/drivers) at risk of danger. I pledge to continue to inform those around me of the hazards of driving fatigued & the importance of proper rest.
This term I, along with my group, was challenged to design and build a model of a building that is capable of withstanding a major earthquake. Our model must be made completely out of spaghetti & blue tack, and within a budget of $60.
To have a successful building you must incorporate multiple earthquake proof features to minimize the damage done to the building. We needed to take into consideration, swaying and irregular movements when looking at what design would be best. We then need to look at our money and decide how we were going to spend it to maximize our resources.
Below are multiple design features researched and considered when making our first model.
The design my group chose remained within budget with some wiggle room, whilst including a good building design to keep our building structurally stable. This build included triangles as they have a rigid structure to help support the building, we included cross bracing at major parts of our building to keep the vital parts of our building well supported. We also have most of our weight below half way so it won’t sway violently if a major earthquake occurred. The excess in the budget allows for it to either be saved for later use, or can be used to further improve on the building design, like adding a diaphragm at the base to help out in an earthquake. Therefore, this design is effective because it uses multiple earthquake safe features such as the cross bracing in two different places and the triangle at the top.
Our first official design
During testing, our building took heavy damage from the earthquake because of the few weak elements of support. As noted in my designs, the cross bracing allows the vibrations to travel, taking away the pressure from the corners. The cross bracing also means that the building has room to sway without falling apart or collapsing in on itself. Since the cross bracing was weak it broke apart, making the building unstable. A way to have avoided this was to double the noodles to add extra thickness.
Our design had multiple cross braces which allowed it to have room to sway, this meant it was harder for the earthquake to cause the building to collapse in on itself.
Our design was limited by the $60 budget which meant that I had to make decisions on what to keep allowing for certain design features had to be cut.
Our design was partially resistant to twisting because of the triangular pyramids which made up half of the model. This was effective because triangles are incredibly resistant to earthquakes because of their flexible structure.
Since this model was being built on top of ground level, I was not able to incorporate a diaphragm at the bottom. This is because diaphragms sit in the ground and distribute the forces in the building towards the columns at the bottom. Since there was no “bottom” the columns would have just been stilts for the building and made it less stable.
Our design had a small base which meant more money could go towards height and support. The 10×10 base allowed the building to be more compact and stable.
Our design relies heavily on the supports at the bottom and the pole running through the middle. The meant that when the pole originally snapped, my whole middle fell apart. As seen in the video above my support was weak and caused the building to break apart.
A table outlining the pros and cons of our original design
As we were re-building our original design, we decided to add some extra support as we had the budget to and we decided it would help the structural integrity of the design. We decided to improve our design by adding internal cross bracing and a pillar in the middle of the building to connect it all up with, we connected it to cross section and stress points to help with the earthquake. This helped with stabilising the building, and on top of what we did, we could use our resources more effectively, making sure that the spaghetti and blue tack is well connected and used sparingly to maximise cost efficiency and reduce cost. We now had a better approach when building, as it took some time to fully construct the building the first time. First we built the bases and levels that could be pre built, then cut and measured other extra pieces of spaghetti. We then connected it all together using the whole group to hold and stick the pieces together and finally inspect the design to make sure all points are connected properly and there are no wonky or straight pieces. We also have realised that because of the pyramid the 25cm long pieces of spaghetti don’t go straight up, so we had to increase the length of the single top piece by about 4 cm. Creating a design that keeps the building neat and tidy will help when making adjustments and analysing our structure, this will help to further enhance how well our build performs. Our new design and build can be seen below.
Left: design of our second building Right: an image of our new model
The implemented design changes, made our structure easier to build and more effective against earthquakes. We pre-prepared the pieces of spaghetti that we used so they were all the right length, and then built the structure up in a logical order to make it easier for ourselves, we first built the base of the structure and the pyramid and the piece at the top next, we proceeded to connect the two sections together while adding the cross bracing and the piece of spaghetti that ran through the centre. We made sure to use the blue tack wisely, covering all sides of the spaghetti, to ensure the pieces of spaghetti would remain unchanged and together in the event of an earthquake. We made sure that our structure was upright and unbending, this helped to keep a stronger stance for our structure to keep its integrity. We measured our design at the end to make sure it was within the required dimensions for our design challenge, it measured 10 cm by 10 cm at the base and 60 cm tall. We were able to analyse any issues as we made the structure neat and presentable, so it was easy to see possible downfalls of our design.
When we re-tested our structure, it was able to withstand the force of the artificial earthquake, it stood strong for 10 seconds at a catastrophic level of impact. It remained under budget only costing $55 as we used less blue tack while not compromising any of the structures connection points. We also noticed that it seemed to handle the impact of a simulated earthquake better than our previous design. Our new and improved design managed to better fill out the criteria for this task, as we were able to learn from our mistakes and take advantage of our prior designing and building phase of the process.
When reflecting on my groups teamwork, I think my strengths were doing the designs for my group and applying all our research to produce a building that would be capable of surviving an earthquake. During this engineering challenge I have learnt that effective communication is key to being successful. In my group me had many instances where we would be missing a member and would have to work around this. However, due to us planning ahead and informing each other of when we would be out we were able to still get our work done by optimising emails. I have also learnt that compromises need to be made when collaborating with others. Although at first my had conflicting ideas about what we wanted to create, we ultimately landed on a final agreed design of mine.
Overall this design task was challenging, but very rewarding in the end.
In term 1 the individuals of the math classes in year 9 have been set a task to collect data and information on a topic provided. Emily and I have been given the topic, Music. To gain the best data we possibly could we did two surveys. The first survey was created by the staff of the college and all the members in year 9 participated. The second survey was created by Emily and me and only the members of Ms. Mast Year 9 maths class took part.
“Music is life itself” – Louis Armstrong. Music, Everyone has heard of it and almost everyone uses it. Music means many different things to many different people. Studies show that 68% of people globally listen to music every year. The aim of our surveys was to see how music affects peoples day to day life.
Year 9 math Cohort survey:
The year 9 maths cohort filled out a survey that had many different questions on many different topics. That data was then used for different pairs based on what their topic was. Around 141 people took this survey. The questions that were asked were, what app do you listen to music on, do you find it helpful to listen to music while doing homework and how many hours a day do you listen to music? Because the sample size was not very large the results only reflect the year 9 students thoughts and beliefs who participated in the survey.
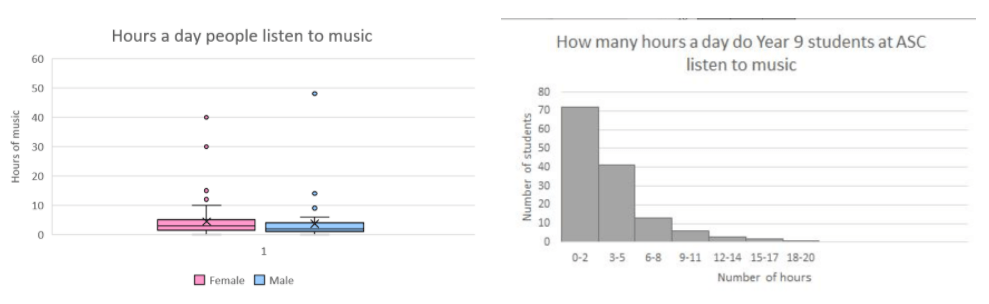
How many hours a day does an individual listen to music.
This histogram and box and whisker plot above show the number of hours that an individual listens to music each day. 124 people participated in answering this question. 72 people voted for listening to music between 0 to 2 hours a day, which is 58% of people. Interestingly music is a huge part of many people’s lives with 21 people listening to music between 6 to 14 hours.
There were a few outliers within this chart, someone said they listen to music for 40 to 42 hours a day which just can’t be possible so we removed it from our data. Without the outliers, both the box and whisker plots for males and females are almost symmetrical. The mean of the average for our data was 9 hours but once we took out the outliers the average was 6 hours meaning on average that is how long an individual in the year 9 cohort listens to music for. The rage for this data was 48 which shows that there was a very big difference between the most voted hours and the least voted hours. Interestingly the middle 50% of people in both males and females in the box and whisker plots are similar or almost symmetrical. Both the median and mode were 0-2 hours, this was the most common answer.
An interesting feature of the histogram is that it is able to show us that as the hours got longer the number of people who voted for them got less. These graphs are able to show a great visual representation of the data, it can clearly show and identity and outliers. The data was able to tell us that many people listen to music for a number of hours each day.
This bar graph above shows how helpful an individual finds it when listening to music while doing homework. They had the options of picking from, always, sometimes, rarely, and never. 141 people took the survey. For each gender “Always” we the highest voted which Is the mode. This shows that the majority of people find that listening to music while doing homework is helpful. Interestingly, more women always find it helpful to listen to music compared to men.
59% of women chose “always” compared to 44% of men. This may be because women find it more helpful to get more work done when they have background noise e.g., music. This may also support the stereotype of women being more creative and enjoy listening to music compared to men.
An Interesting feature in this graph is that it is positively skewed. As the frequency of listening to music while doing homework gets less rare so do the votes for that option.
The interactive pictograph above shows a visual and interactive demonstration of the responses we received on the question, whats your most preferred way to listen to music? Research has shown that 138 million people use Spotify each year. As you can see by looking at the graph Spotify is very popular in the year 9 maths cohort. 77% of people who answered this question picked Spotify. The reasoning for this may be because Spotify can be a free-to-use app that has many features therefore it very accessible to many.
An interesting feature about this pictograph is that Spotify has outnumbered the other apps and services by a lot, this is a lot different from other graphs because there are usually at least two options with a similar amount of votes. This means that Spotify is used a lot more compared to YouTube or Apple music.
———————————————————————————————————————————
Ms. Mast year 9 class survey:
https://youtu.be/sGQQ1vchyz8
20 members of Ms. Mast’s year 9 maths class participated in a survey that asked multiple questions on the topic of music. The questions were, your gender, do you listen to music for more than 1h a day, and do you get more work done when you listen to music. This survey was slightly biased because it was not confidential meaning that we could see who said what, this then leads people to not answer truthfully because they may be scared what they think is different from what others think. The sample size was very small in this survey so the results only reflect on the students of Ms Mast year 9 math class.
The two pie charts above display the results to the question, do you listen to music for more than 1 hour a day. Pie charts are a great way to share data visually without much wording involved. 12 females and 8 males answered this question. responses ranged from 3 to 12.
Interestingly, 100% of the females responded with yes, this indicates that women are more likely to enjoy listening to music compared to men. 62.5% of men responded with yes and the other 37.5% responded with no, furthermore this helps to support the idea that not all men find enjoyment in listening to music.
Overall these pie charts visibly show that women are more likely to listen to over 1 hour of music a day compared to men.
This bar graph above demonstrates the results of 20 responses, When you listen to music do you get more work done? 12 females participated in the survey and 8 males. Participants of the survey had the option of picking from yes or no. 83.33% of females said yes compared to 62.5% of males. This may suggest that males find it distracting to listen to music while completing work.
Interestingly even though there was a fewer amount of males that took this survey majority of them still chose “no” as an answer. This further proves my theory that males don’t enjoy listening to music while doing work. 75% percent of participants that took this survey believed that they get more work done while listening to music.
This graph upholds the thoughts of women finding that listening to music improves the efficiency with which they work at. People who answered yes to this question were then asked why that is, many people said things like, “it blocks out distracting sounds”, “it helps me concentrate” and “it makes me more motivated to do work”.
Overall all these surveys were able to demonstrate the fact that music plays a huge role in the lives of Year 9 students. There were a few limitations within the surveys because the sampling size wasn’t very large, therefore meaning this data cannot be used globally or for anyone outside the ages of Year 9 students (14 & 15). The data also supports the idea of women finding it beneficial to them to listen to music while doing daily tasks like schoolwork. 100% of people in the Year 9 cohort like to experience art through music. Studies have proven that music improves things like an individual’s mood and how they feel.
Our legal system aims to follow the principles of justice in order to provide us with a fair legal system. These principles however are not always upheld. In the Mickelberg brothers’ case the principles of equal treatment before the law, innocent until proven guilty & right to remain silent were compromised. However, although they were initially convicted the principle of justice, right to an appeal, was upheld and ensured that ultimately their convictions were overturned, and they received justice.
In 1982 49 gold bars weighing 68kg were stolen from the Perth Mint. Three brothers, Peter, Brian & Raymond Mickelberg who were at the Perth Mint at the time were believed to be behind the heist. During the investigation police went into the brothers’ house and found a few gold bars under their floorboards. These gold bars however were legal with receipts of proof. The raid was broadcasted on TV to the public, causing doubt in the community of their innocence. While being interviewed by police there was no legal representation present for the brothers & they were beaten by the police while naked. In 1983 the brothers were found guilty of conspiracy & were sentenced for the crime. This was due to the police faking fingerprints on cheques, lying during the trial & coercing the brothers to write false confessions and other pieces of evidence. In September 1982, the brothers pled guilty to an unrelated case for stealing the “Yellow rose of Texas” a gold nugget. The police used this for more evidence. The brothers appealed many times & in 2004 their convictions were overturned & they were freed.
(left) Gold bars & (right) Perth Mint
Equal treatment before the law means that everyone is treated the same, independent of their gender, race, religion, past history, etc. This is important because it means that everyone has a fair trial and has the same treatment, therefore giving us a fair, unbiased legal system. In the case of the Mickelbergs the brothers were framed by the police & were treated unfairly due to an unrelated case they plead guilty to. This unrelated case was about the stealing of the “Yellow rose of Texas”. The brothers were also kept behind and questioned by the police after all the other staff had gone home. This shows the compromise of this principle & how they did not receive the whole of the justice system.
Innocent until proven guilty means everyone is to be assumed as innocent until they have been found guilty of an offence. This is important because it gives everyone a fair chance and means you cannot receive any judgement or wrong treatment until you have been proven guilty of a crime. In the case of the Mickelberg brothers they were assumed to be guilty from the beginning & as a result were framed for a crime they did not commit. Once they pleaded guilty to the “Yellow rose of Texas” case the police used this as evidence as to why they were guilty of the heist, painting them as thieves. Due to their other case being gold the police linked them together and assumed they were responsible for this heist. This shows how they were not innocent until proven guilty and how this principle was not upheld.
Right to remain silent means during an investigation & trial you have a right to not say anything or write anything. You are only legally bound to give your name, address & phone number. This is important because it means we do not have to prove anything, and prevents us from unintentionally giving information that could be used against us. It also outlines the rights we have and how much power the police & investigators are entitled to. In the case of the Mickelbergs, Peter was stripped naked and beaten while being interviewed. This was done to coerce him into signing false confessions & statements that could be used as evidence against him & his brothers. A statement released by Anthony Lewandowski, one of the two officers in charge of the case, claims “Don Hancock came into the room and told me to make Peter strip naked. Don then went up to Peter and gave him two or three quick punches in the solar plexus. The statements purportedly taken from Peter Mickelberg on July 26, 1982, were in fact not taken in Peter’s presence that day, but were a fabrication made by Don Hancock and me shortly after September 2, 1982”. In relation to the events at the brothers appeals, he also stated “I gave evidence at the trial and numerous appeals. All that evidence in relation to the so-called confessions was false”. This shows a clear violation of their right & this principle.
Right to appeal means that once a decision has been made you have a right to ask for it to be reviewed if you believe the decision was incorrect or parts of the legal procedure were not followed. This is important because it means that everyone has a right to have their case reviewed as many times needed in order to receive justice and shows a higher chance of receiving justice if it is looked at multiple times, therefore giving us a better legal system. In the Mickelbergs case the brothers appealed seven times, each being unsuccessful. It wasn’t until Anthony Lewandowski spoke out that they succeeded. From this we can see that the rate of having a successful sentence appeal is low, this is supported by research done that found that less than 10% of appeal applicants were successful. However, this right, the confessions from the police & Royal Commission is eventually what led to them having their convictions overturned.
Brian & Raymond Mickelberg
These paragraphs of evidence show that although our legal system strives to do its best, the principles of justice are not always upheld. We can see this through the Mickelbergs case & the result it can have on receiving true justice. However, I believe that even though our legal system is not perfect it is still improving and becoming better over time. We can see evidence of this from the Mickelbergs case being in the 1980’s and the way it was carried and how justice is carried out now. We can also see that our legal system uses past case like the Mickelbergs to learn from so we can ensure that we do better next time.
$20 Boss was an opportunity for year 8 students to become young entrepreneurs.
The events that led up to the selling day were planning, making & marketing. My partner & I first started with planning our design. We chose to make bags with pockets, pouches and cable holders. We split the planning workload in order to make it more efficient. I did the step-by-step planner and my partner worked on our name and logo. We went through many different options for our name, but the final one was given to us as a joke from my partner’s dad.
The research done was through surveys with the cohort to find out how to better our idea and to see who would purchase it. I have empathised with my audience by making a bag that is practical and comfortable to have.
My partnership worked really well, with me handling the paperwork and statistical side, and my partner doing the creative and making aspect.
Overall, This was an amazing learning experience for me.
In 2019 I took part in a whole year course titled Innovat[ED]. Innovat[ED] is a practice that helps guide young children to become future or present entrepreneurs. From this course I learnt important skills such as; leadership, communication, creativity, self-management & problem solving. One power I have been interested in is resilience. This is the power that enables you to keep going when attempting something challenging. When doing the ozobot activity, resilience was used to make sure I kept calm so I could continue to find a solution to the problem I was faced with, which was programming my ozobot to complete certain tasks.