What is YOUR favorite sport to watch?
Wiremu and I are currently studying the statistics and averages for what peoples favourite professional sports to watch are. We chose this topic because we already know quite some information about sport and love to play and compete inside of any sport. The reason we are studying the results are because people who identify as sports fans have higher levels of self-esteem, lower levels of loneliness and tend to be more satisfied with their lives compared to those who aren’t interested in sports. Fans also tend to have more access to social support, help, and resources as well. This is why sports fans tend to find the statistics and averages important or helpful to their lives.
The team identification–social psychological health model predicts that sport team identification leads to social connections which, in turn, result in well-being.
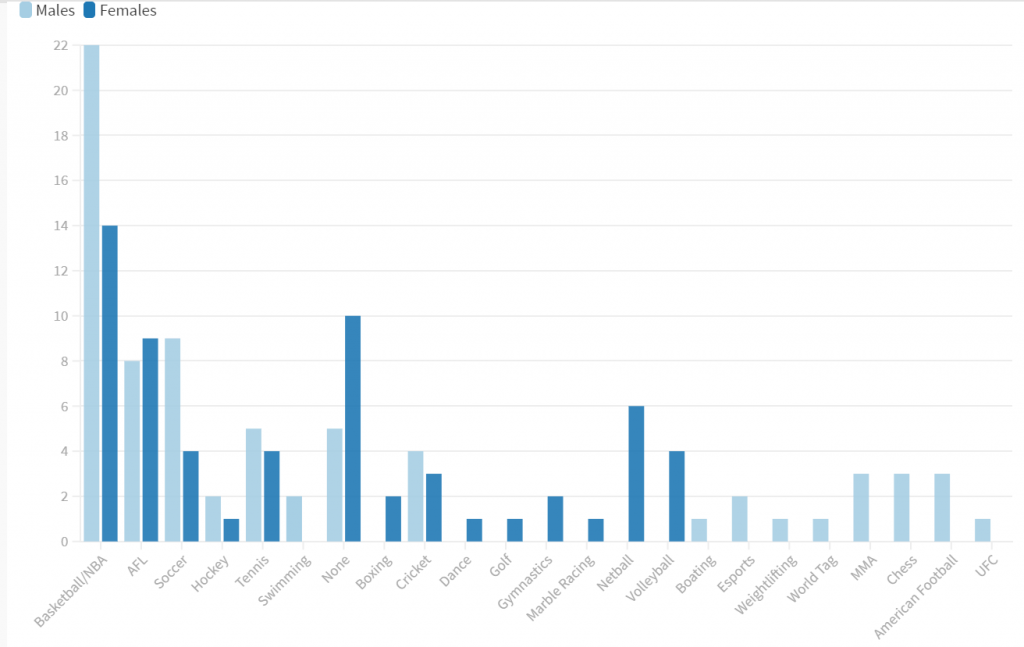
This is the Categorical Graph,
In this categorical graph, it shows that basketball is the highest watched for both male and female. UFC, World tag, weightlifting and boxing are all tied for the least watched for males. While Golf, Dance, Marble Racing and hockey are the lowest watched sports for females.

This is the Numerical Graph,
In this numerical graph, the data shows that Weightlifting and UFC are tied at the most watched sport for males, however, not many people decided to watch UFC or Weightlifting but the people who did watch those sports must enjoy them a lot. The females liked to watch golf but the same thing applies with the males how not many people chose to watch golf.

This is box and whisker
This type of graph is used to show the shape of the distribution, its central value, and its variability. The median for males is higher then the females.

Our data was an example of a convenience sample, but the survey was compulsory. we sent out a survey to all students in year 9 to see what is there favourite sport to watch and how many times they watch it in a week. However, this data can be wrong considering the survey was taken anonymously and some people like to mess around so there will be outliers throughout the data.
The survey was sent out to year 9 All Saints Students and we are generally a healthy and sporty place to be at. This changes the results from other schools cause they could be less active and healthy.
0 comments on “Year 9 Math’s Project” Add yours →