EJ Tan and Ryan Mouton.
Our Rationale
EJ and I are researching how long a year 9 student would relax and do recreational activities for. We are also researching if they would prefer to do so indoors or outdoors. Our information could change depending on the gender or preferences. We chose this topic because we believe that this could help schools and recreational centres improve and upgrade. Therefore, more year 9 students could get more exercise.
Validity and Reliability
In our research we used convenience sampling to sample the year 9 cohort. In the survey we have minimised the amount of bias by allowing all participants to do it privately, although we did do the survey privately other influences like their parents or their friends could alter the end results. We sampled 141 people in the year 9 cohort.
Outliers
There seem to be no outliers in the test. This is because you are given a set of numbers to choose from instead of choosing your own. But there seems to be lower numbers at the start then begin to rise then fall like a hill.
Categorical Data
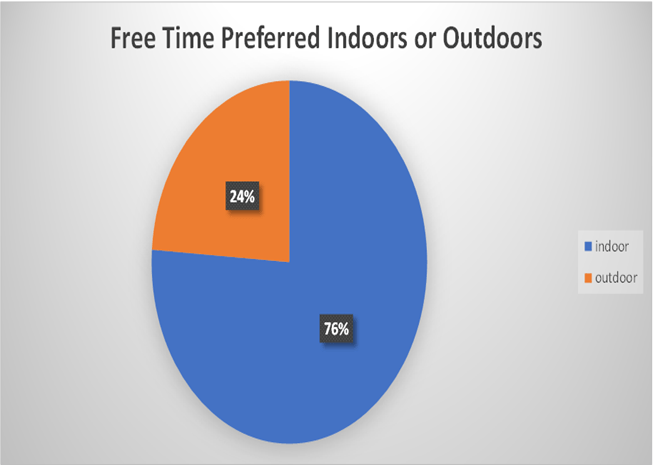
When you have free time to relax, do you prefer to do so indoors or outdoors?
- Mode = indoor / indoors (108) Outdoors (34).
- Indoor percentage 108/142 = 0.761 * 100 = 76.1%.
- Outdoor percentage = 34/142 = 0.239 * 100 = 23.9%.
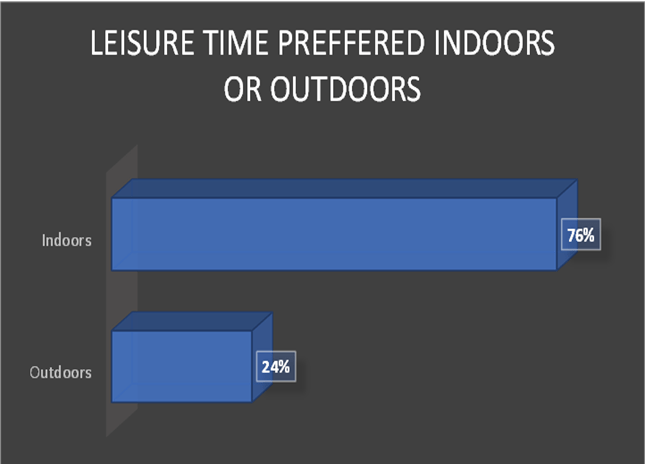
Our graph is very one-sided. Indoor leisure time is 76 percent while outdoor leisure time is 24 percent.
I believe our results turned out like this because more teenagers like to use their phones and be inside instead of outside.
Numerical Data
In a typical weekday, how many hours do you spend on leisure activities (e.g., going for a walk, playing a game with friends, doing a hobby you find relaxing, etc.)?
- Female=66
- Male=72
- Non-binary=3
- Sample size=141
- Sum of all numbers=499
| NUM 0 | NUM 1 | NUM 2 | NUM 3 | NUM 4 | NUM 5 | NUM 6 | NUM 7 | NUM 8 |
| 5 | 21 | 39 | 19 | 12 | 12 | 11 | 7 | 15 |
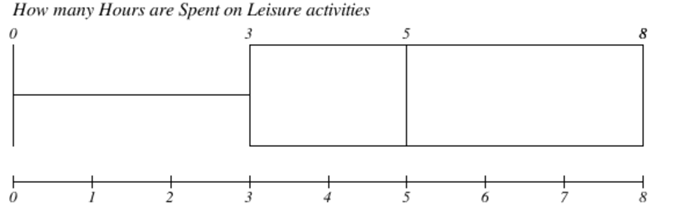
| Mean | Mode | Median | Range |
| 3.539 | 2 | 3 | 8 |
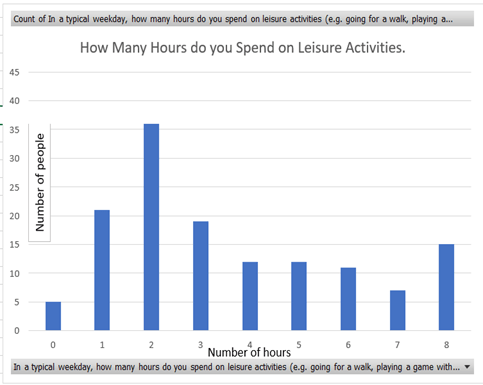
The data used was discrete data because there is only a set number of times. The column graph shows that it is positively skewed. The column graph has a significant difference with 2 at the highest and all the other numbers just following behind it. I believe that most people chose 2 hours because they don’t have time to do more because of schoolwork and other commitments.
Limitations in the lask?
There were no limitations for the task but there were some complications for the task. It was difficult to calculate the quartiles in excel because of some technical difficulties.
Teamwork
EJ and I worked well together on our project. We both split our tasks evenly and we both worked independently. We had a little trouble communicating but we managed to finish and present it on the due date.
Our experiences, what we can learn and recommendations
I believe that our experiences in this project will help further us in other assessments and other projects. I need to manage my time to a higher standard than what I have been doing. I need to communicate more in these kinds of projects. We also experienced lots of technical difficulties but this just means that we will be more prepared in the future.