We are researching the study habits of year 9 students at All Saints’ College. This research is needed so we can understand how choosing whether we want to take an ATAR course or General course would affect the amount we study. We have surveyed all the year 9 students to make the data accurate. Although this data is only accurate for our school as other schools might not have a large amount of student wanting to take an ATAR course.
Our initial thoughts were that students who are aiming to take an ATAR course will study more than students who aim to take the General course. These results have been collected from the entire Year 9 Cohort (141 students).
Eliminated bias: ways we have eliminated bias:
– Sample order bias. All year 9s have been surveyed.
– Question order bias. Questions on the survey were randomised.
– Social desirability bias. Questions on the survey use impartial language.
– ‘Yes-man’ phenomenon. Same strategies as social desirability bias.
The questions in the survey were randomised to eliminate sample-order bias. We have surveyed all Year 9s to be more accurate. Questions on the survey use impartial language to avoid social desirability bias and ‘yes-man’ phenomenon.
We understand the sampling method is biased because All Saints’ College is a well-educated school, and more people are likely to choose an ATAR pathway than other schools. The sampling size is all Year 9 students and at this point some people might change their mind before making their final decision about their pathway.
We are researching this topic in interest of understanding the different study habits of students in Year 9 who want to take an ATAR course or General course. The data in the graphs represent the different amounts of time students do homework each night, and if they find it useful to listen to music while studying or doing homework.
Conversion of frequency to percentage:
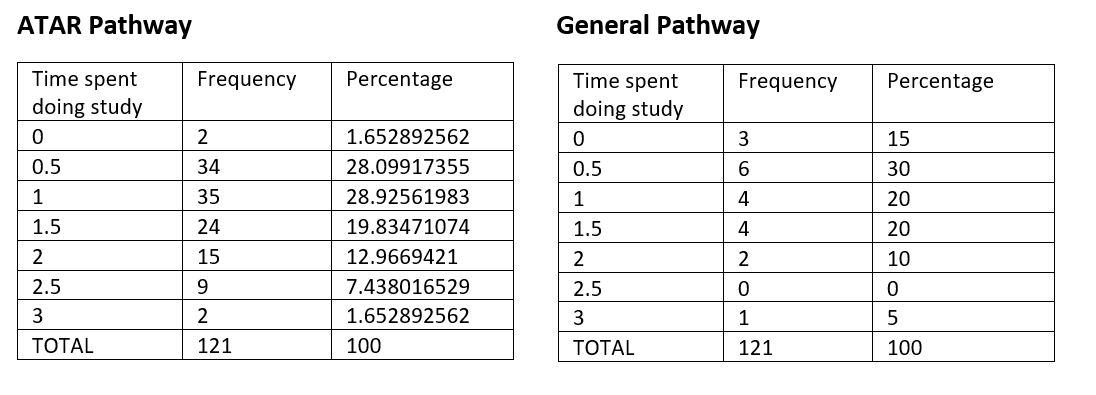
The graph below represents and shows the percentage of people aiming for the ATAR Pathway and how long they study for each night compared to how percentage of people aiming for the General Pathway. As you can see from the tables above there are a lot more students at ASC aiming for the ATAR Pathway, we can assume this is because All Saints’ is a high fee-paying school which rises expectations in both the students themselves and their parents to do well in the future. With 121 students in Year 9 aiming for ATAR and only 20 aiming for the General Pathway. Our hypothesis was correct though as we thought that people who are aiming for the ATAR Pathway would study more than students aiming for the General Pathway.
What is really interesting about this graph is that both sides of the graph are both positively skewed. This suggest that more people in both categories study less more other people. Both graph peak at around 0.5 – 1 hours per night, whereas the highest score for both groups was 3, although 3 was not an outlier it was a choice that wasn’t picked often.

The parallel box plots show the time (on average) students in which 2021 Year 9 students at All Saints’ College study for each night. The responses ranged from 0 hours to 3 hours. Students who are aiming to take the General Pathway in Year 11 and 12 had a lower mean value in which tells us that students aiming for the General Pathway study less.
The mean, median and mode of the students aiming for the ATAR Pathway are all higher than the mean, median and mode of the students aiming for the General Pathway. Interestingly the range, quartiles, minimum and maximum are all the same.
Our next question was about how many students found it helpful listening to music while studying, what is interesting about these pie charts is that a lot more people in both categories find it helpful to listen to music than not to. The choice ranged from Always, Sometimes, Rarely and Never.
For both categories Always was the most popular option with 50.41% of students who are aiming for ATAR choosing it, and 85% of students aiming for General. We can again, take into account that a lot more students at All Saints’ choose the ATAR Pathway.
There can be bias in our project due to All Saints’ College being a school full of well-educated students. This creates bias because many more students have chosen an ATAR pathway than another school with different circumstances. These results cannot be summarised as all Year 9s but only the Year 9s at ASC. These results of how many hours Year 9s study can be implied to the school by knowing how much time Year 9s spend on homework or study. The school could understand the difference of study habits of Year 9s wanting to do an ATAR or General pathway. Future research could include several more surveys like this across the school for different Year groups. We believe as you age, the difference between the amount of study for ATAR or General pathways increases.