In this math task the year 9 cohort had to complete a survey and we were given the results to complete a math assignment. We had to pick a group then choose our topic then sort through all the data and make a set of graphs and statements about the data. This is the end result of that assignment that my group and I have created.
What did we do?
We researched the favourite book genres of year 9’s and how much they read. The results will be interesting as we will explore how different things such as gender, books read, etc.. effects how much people read and their favourite book genres. This information could help book writers, book stores and libraries by giving them some suggestion to help them write or sell books which are relevant to the current population. This might help by decreasing technology usage, which is an important modern issue, of this year level. There has been little research done on this topic and therefore it is important for us to conduct this survey and record the results on infogram for future use.
Data Bias and Survey type
I think that the sampling method was a convenience targeted sample. This was because it was targeted to year 9’s at all saints as we were convenient. This introduces bias simply because the year 9’s at All Saints cannot represent all the students at All Saints and all the year nines in the world. Another form of bias is that  All Saints contains high paying students and parents for high education. This means that this data cannot represent the year 9’s of lower pay and education. The sampling size is would be biased if it represented all the year 9’s in the world or the entire population of the school. This impacts the generalizability of our results as it only really represents the higher end of education and pay and therefore it cannot be used for all year 9’s or students.
The data reliability
The reliability of the survey is a tiny tiny tiny bit low. In the survey, it did not give a definition of a book. This means that students might ask: “do audiobooks count as a book?” “What about manga’s/comics?” or “My grandma bought a smartphone with a user manual, does that means my grandma reads more books than me?” Even though the definition of ‘book’ has been a bit confusing in the survey, the survey itself still gives useful information. It could be biased only if the students decided to put in false answers and incorrect information which would hinder the data reliability. This is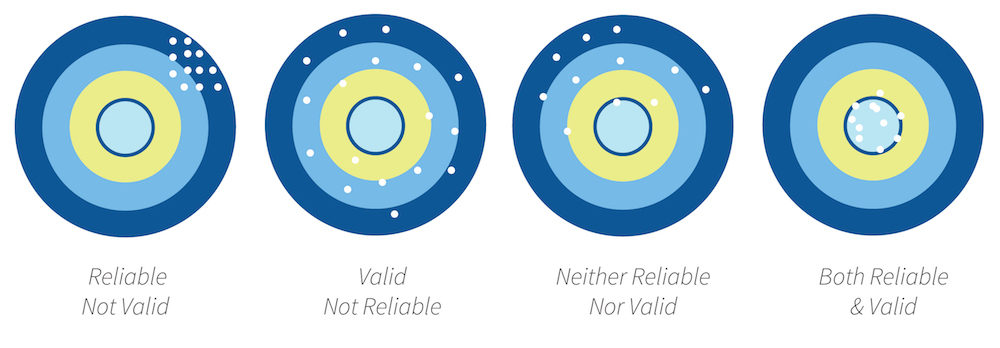 evident as we had a Non-Binary section in our data in the box plot and it had a ridiculously high result (365). This skewed our data and its reliability as it was a false answer (we eventually found this out and deleted the response in our data). Another example would be the book selection itself. Another example of false answers are that people put non-binary as a joke so we had to go through and delete this. as we have stated before some students might wonder what counts as a book, comics, user manuals etc… this hinders the results as they do not know what to put and therefore they may not have put their true answer meaning that not all the answers are accurately making some of the data unreliable. This makes some of the data bias as it is inaccurate and unreliable. With this being said though much of the data was quite reliable and useful.
The Data and Graphs
here is a PowerPoint with all the data and graphs shown above Project book ppt (2)
Our Conclusion
In conclusion, from the ‘favourite book by genre’ data, we have found out that girls and boys have different tastes in different book genres. From ‘amount of book genres read by their genre’, the data shows there is not an absolute favourite book genre read by year 9 students in All Saints’ college year 9. From the ‘amount of book read by different genders’, the result shows that the amount of books read by girl has a higher mean and mode compare to boys (probably because boy plays too much video games).
Lastly, in the amount of book read by year 9, the static shows that read 0-9 books per year are the most common option to year 9 students in All Saints College. The result of our research can help book writers, sellers and libraries however it only represents high paying, high education students of one particular school meaning that this data cannot be used for the wider population of year 9’s across Australia. However, his data can help libraries, book stores and book writers by allowing them to write and sell books to people and know that they relate to the likings and ‘size’ of the book to help stop and restrict an ever-growing problem of younger generations playing too many video games. Further research can be done in stratified samples of all the low paying-high paying government – private schools and more in order to get a better more accurate result for most of the Year 9s in WA and Australia.
Thanks for reading
Thank you for taking the time to read our Math Task please leave your thoughts or comments in the comment section.