
Sports 1
REASON The reason we choose to do sport one was because sport is very popular to students in year 9. We also wanted to see the variety of sports people play through out the year and what sports people find the most enjoyable and how much effort and commitment they put into their sports and how passionate they are. We also wanted to find out what the most popular type of sport is ranging from ball sports, water sports, strength sports etc.

SAMPLING AND BIASED The survey is biased because of the sample of students we choose to survey. The sample is Year 9 students at all saints college and the results that we received means that we cannot assume that all year 9 students play the same range of sports and practice them. We can only assume that for students with similar social and economical backgrounds.
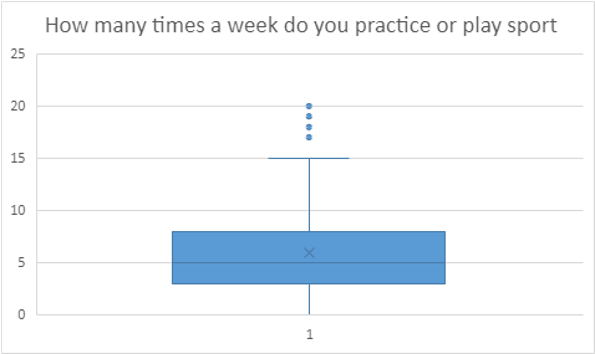
BOX AND WHISKER DIAGRAM NUMERCIAL The result of the box and whisker diagram show where the median is and that there are 4 Outliers from the numerical results.
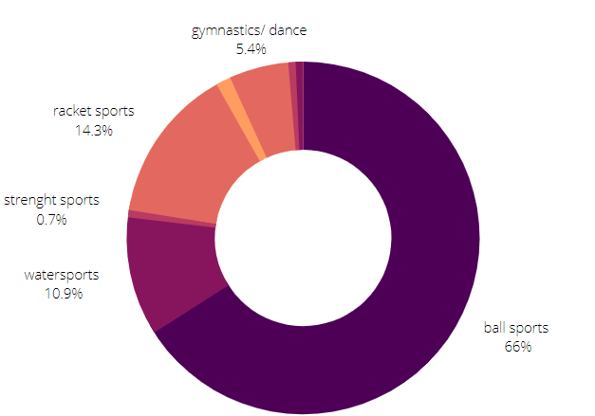
CIRCLE DIAGRAM – CATAGORCIAL Whats your favorite sport to play? As we can see on the pie chat ball sports are very popular for year 9 students at all saint’s college. Ball sports consist of basketball, netball, soccer etc. All saints college has a very strong basketball program and netball. Following after is racket sports like tennis, badminton.

STATS •Mean, Median, Mode •Mean – 5.96 •Median – 5 •Mode – 5 •Range of Data •20 – 0 = 20 •Inter Quartile Range •8 – 3 = 5
OUTLIERS •In the information we have collected from the survey from the Year 9 at All Saints College Participated in for the numerical question there was a result of 4 outliers. Any number over 15 was counted as an outlier.
RELECTION
•What would you do different I would make sure to get as much done and make sure I understand what needs to be done and not wait till the last minute •What went well The end result and also even though Grace wasn’t really here we were able to get as much done when she was and had a good teamwork strategy. •What did u learn I learnt more about charts and about outliers because before I didn’t really understand what they were.