What are we doing?
We are researching the favourite book genres of year 9’s and how much they read. The results will be interesting as we will explore how different things such as gender, books read, etc.. effects how much people read and their favourite book genres. This information could help book writers, book stores and libraries by giving them some suggestion to help them write or sell books which are relevant to the current population. This might help by decreasing technology usage, which is an important modern issue, of this year level. There has been little research done on this topic and therefore it is important for us to conduct this survey and record the results on infogram for future use.
Data Bias and Survey type
I think that the sampling method was a convince targeted sample. This was because it was targeted to year 9’s at all saints as we were convenient. This introduces bias simply because the year 9’s at All Saints cannot represent all the students at All Saints and all the year nines in the world. Another form of bias is that All Saints contains high paying students and parents for high education. This means that this data cannot represent the year 9’s of lower pay and education. The sampling size is would be biased if it represented all the year 9’s in the world or the entire population of the school. This impacts the generalizability of our results as it only really represents the higher end of education and pay and therefore it cannot be used for all year 9’s or students.
The data reliability
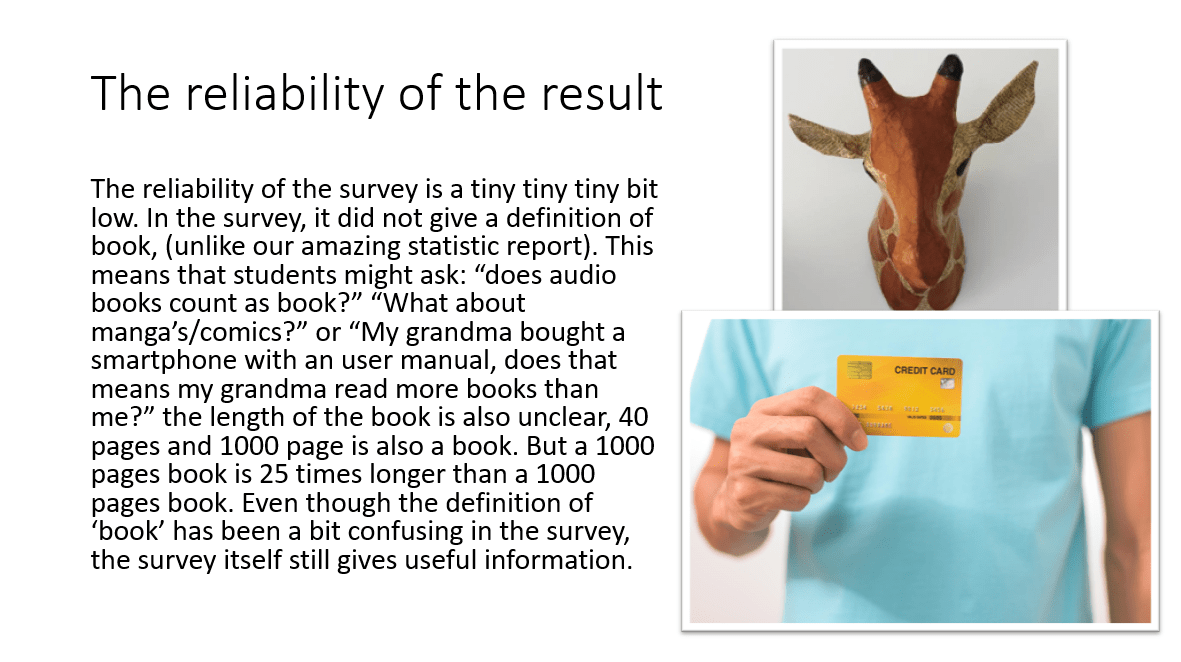
The reliability of the survey is a tiny tiny tiny bit low. In the survey, it did not give a definition of a book. This means that students might ask: “does audio books count as a book?” “What about manga’s/comics?” or “My grandma bought a smartphone with a user manual, does that means my grandma read more books than me?” Even though the definition of ‘book’ has been a bit confusing in the survey, the survey itself still gives useful information. It could be biased only if the students decided to put in false answers and incorrect information which would hinder the data reliability. This is evident in the Non-Binary section of or data in the box plot as it had a ridiculously high result (365). This skewed our data and its reliability as it could be a false answer or they just read a book a day. Another example would be the book selection itself. Another example of false answers are that people put non-binary as a joke so we had to go through and delete this. as we have stated before some students might wonder what counts as a book, comics, user manuals etc… this hinders the results as they do not know what to put and therefore they may not have put their true answer meaning that not all the answers are acute Making the data unreliable. This makes the data bias as it is inaccurate and unreliable. With this being said though much of the data was very reliable and useful.