“Global Goals and innovation through STEM” is a course at all saints college. It runs it’s task through project based assessing. I joined this course for a more hands on approach to issues that are being solved world-wide. These issues includes SDGs (sustainable development goals) There are 17 of such goals that the UN has put in place for all countries to work towards.
The 17 Sustainability development goals
As mentioned before, the organisation that created these goals are the U.N.
The SDG that I’ve worked on for the last semester is goal 14. Otherwise known as Life underwater. Goal 14 focuses on the safety of water and making sure that all water bodies are clean of pollution and save endangered aquatic animals.
The target I focused on here is analysing whether or not a river is polluted at the chemical level. Sometimes a river may, look clean but it’s pH could be very acidic or it could contain larges amounts of ammonia. My project in particular focused on Bull creek. Bull creek is an artificially made water body with the purpose of being a deposit of all of bull creek’s waste water. This extremely dirty water will get cleaned as it passes down the river. The end goal of this is to clean the water before it reaches canning river.
Bull creek has been doing this job since it was 1968 when the river was dug out. The creek was actually named after an early settler by the name of Henry bull, who owned the land since 1830. Before the settlers came, the creek was already a very wet place. In fact it was very significant to the Wadjuk Beeliar tribe. They referred to this wetland as the “Gabiljee” meaning water place.
My project involved many chemical and physical tests down at bull creek to answer one major question.
“Is bull creek doing it’s job?”
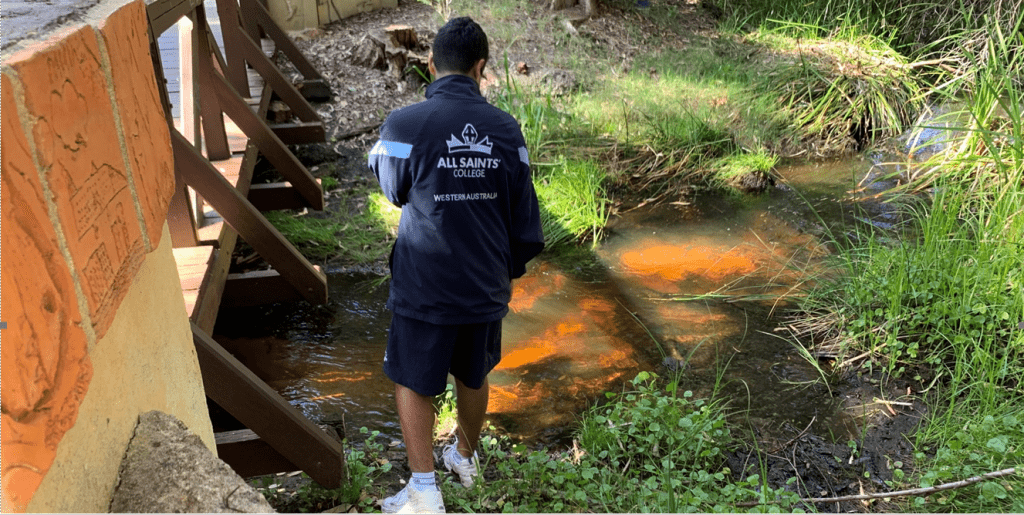
My plan was to make write a scientific report on my findings and compare test results from 2 different sites. The first site was at the beginning of bull creek. This water is expected to be dirty here as this is the place where all the sewerage feeds. The second site is located at the end of the bull creek. This sight is behind Rossmoyne senior high school under a bridge. The water here should be cleaner as it’s only a few metres from depositing into canning river.
Me at site 1
This project is part of goal 14 as it’s focused on helping water quality at the local level here, in bull creek.
Me at site 2
During this project I worked by myself. This meant that I could work at my own pace. During my time on this project I often took breaks and helped my classmates with their projects. Of course I would always get my work done in the end.
In the beginning my goal was to create a scientific report to express all the data I was going to collect down at the creek. It took a while get approval to leave the school and do testing so in the mean time I practiced using the pH indicator and the other tests (Ammonia, Nitrite, Nitrate) on tap water. Curiously while doing this I noticed that the hangar’s tap water is highly alkali.
Once given approval to go down the creek I got to see both sites for the first time. I took with me, two 2L bottles to hold the water from each site, A salinity tester and a bucket. The salinity tester also doubled as a thermometer. This was useful because the temperature would’ve definitely changed by the time I got back to the hangar. During this I had to try and memorise each the temperatures of each site and which bottle holds which sites water. I should’ve planned this part ahead of time. When I got back I entered in my first results and got to testing.
TERM 3
Site 1 (No band)
Site 2 (Red band)
Averages
Temperature (At site)
26.9 C
24.6 C
25.75 C
Temperature (In bottle)
20.1 C
19.9 C
20 C
pH
6.9
7.7
7.3
Salinity
0.40ppt
0.40ppt
0.40ppt
Ammonia
8.0ppm
3.0ppm
5.5ppm
Nitrite
0ppm
0ppm
0ppm
Nitrate
0ppm
0.25ppm
0.125ppm
Consistency
Clear
Clear
Colour
Yellow
Yellow
Debris types:
Brown clumped substance, worm thing, Live mosquito, small organic particles, sand, dirt
Dirt, sand, Small plant roots
Test results 1
The first test was a huge success and now with the data I’ve received I can start to work on the report. The first few stages of the report were very simple. I needed to write a hypothesis and materials. I even learnt how to write additional parts of scientific reports that I’ve never known about previously. For example a risk assessment.
Finally came the day when I would do, what I thought would be my final journey to bull creek. I emptied the water from the previous tests and cleaned them and my other materials. Mind you, these two testing dates were months apart. I was very curious how different (or similar) the results would be.
TERM 4
Site 1 (No band)
Site 2 (Red band)
Averages
Temperature (At site)
23.33 C
26.7 C
25.015 C
Temperature (In bottle)
19.0 C
18.9 C
18.95
pH
8.1
8.6
8.35
Salinity
0.40ppt
0.40ppt
0.40ppt
Ammonia
6.0ppm
0.50
3.25
Nitrite
0.5ppm
0.5ppm
0.5ppm
Nitrate
0ppm
0ppm
0ppm
Consistency
Clear
Clear
Colour
Yellow
Green
Debris types:
Small swimming insects, debris from flowers,
Lots of green vines (Appears to be growing), organic debris
Test results 2
The second test taken in Term 4 was very different to the first test, just as I’d hoped. Unfortunately though, a problem came up. Amongst my plethora of tests I had two pH testers. One was a digital stick and the other was a solution based indicator. The problem lay with the data collected from them. The two pH testers gave me drastically different results. Perhaps the digital tester was calibrated wrong or the solution test was diluted. The only way I could find out the true pH was to use a Universal indicator.
So, with the help of my teacher Mrs Donnelly, I borrowed one from the science office and tested both term 4 sites again. Unfortunately I couldn’t test the term 3 sites. But this was better than doing nothing.
TERM 4
Site 1
Site 2
Universal indicator pH
6
6
Universal Indicator results
The universal indicator test has shown us that the previous results were largely exaggerating the rivers alkalinity. Instead both sites sit at a pH of 6.
Of course, the only thing I’d do differently was to use the universal indicator on all 4 tests rather than the later two. This wasn’t possible because by the time I realised the error in the pH tester the Term 3 tests were long emptied. Maybe next time.
The end of goal of my task isn’t yet finished as I still need to compare the data against each other and again with the ideal river qualities. This leaves two options. Either bull creek is doing its job. Or not. If so then we can leave it or monitor it incase something changes. If it isn’t then I will start a new project on how we can fix this and make sure bull creek functions as it should to make a healthier canning river.
During this project I found that I had improved on my
Finally, I would like to thank my Teacher and classmates for helping me with all of the testing and being patient with me as I dragged them down the creek for testing every so often.
Term 4 science was centered around the Earth. My classmates and I studied hard on volcanos, sections of the earth, deepest points on earth and water and most importantly, Earthquakes.
The project my group (Jaxon, Zaid and Marcus) and I worked on was to create a structure out of raw spaghetti sticks and blue-tac. Raw spaghetti is very brittle so this wasn’t going to be an easy task but my team and I were up for the challenge.
The first stage was planning. During this we made up to 11 different sketches of how the structure will look. This included notes on earthquake resistant build techniques implemented by real world scientists and engineers. The most prominent build style was cross bracing.
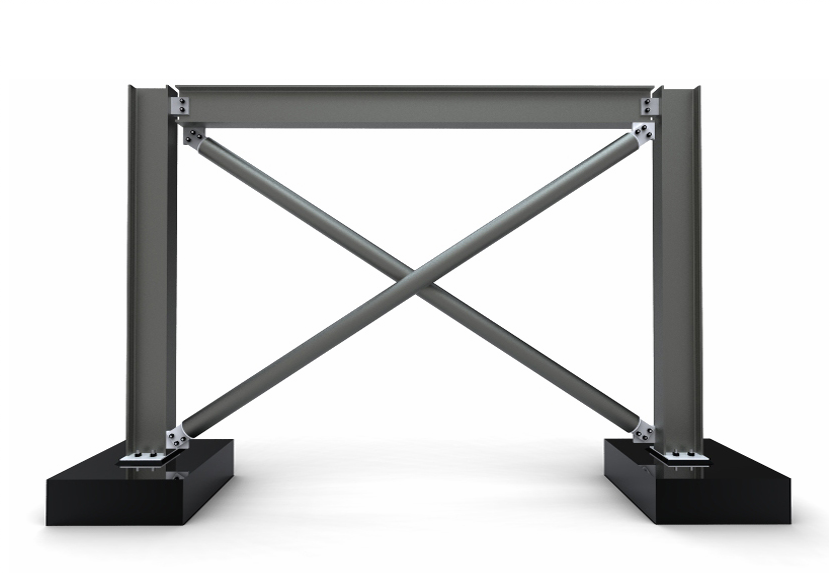
Cross braced structure
Cross bracing is a technique used by engineers that involves a cross between two pillars. This transfers weight away from the structure during an earthquake and reinforces the pillars it’s attached to. We included this type of wall on all three sides of our structures.
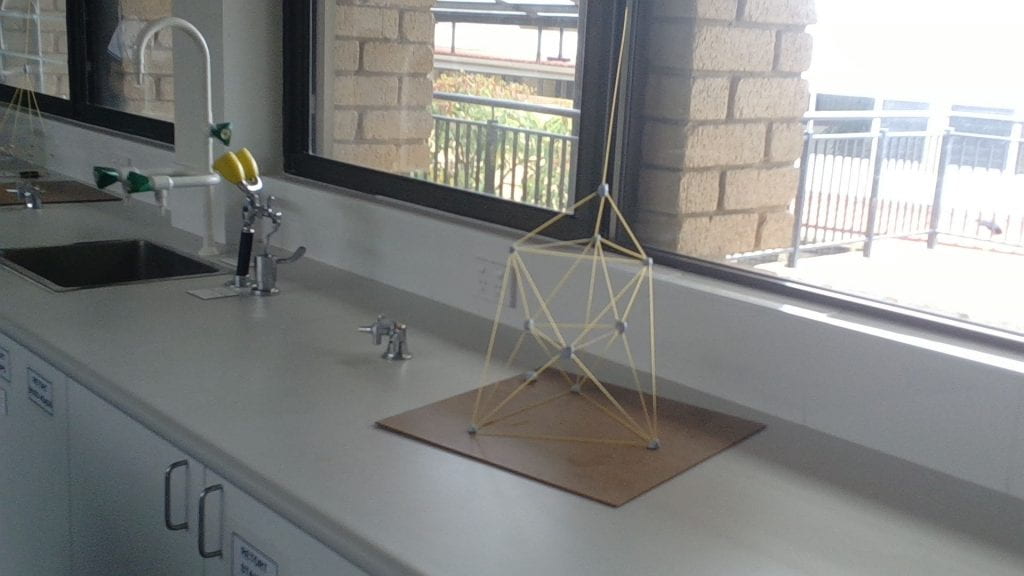
Design 1
Our first structure was a huge success and it survived the shake test. It also met all of the requirements asked of us. But the problem with our design was the roof. The antenna swayed and appeared as if it would take the roof off. Fortunately it doesn’t but this is a risk that my team and I aren’t willing to take and it easily finds itself on the improvement list for design two.
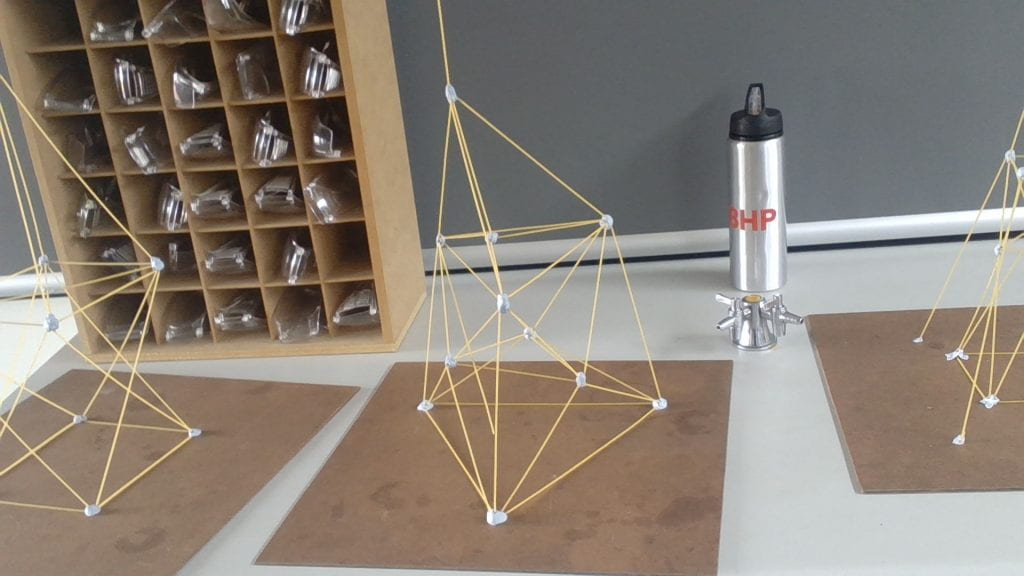
Design 2
After noting down the parts of design one that needed improvement we reached the building stage. This was the final part of our project. Jaxon had drawn at least 10 different possible sketches since the time the project was released to us. But the final product was a disaster. As the due date drew nearer and nearer the builds became rushed. The first build was built entirely by Marcus but the second time around we all tried to build at once to speed things up. In the end we did implement the improvements and they did work. But it came at a cost of making the rest of our structure less so.
In the end I believe that our group worked very hard on this project. In the end our “Improved” Design was worse but through the way we all contributed equally to the project regardless of the outcome. I feel this was a good learning experience that my group members and I can take to future projects.