Term 4 science was centered around the Earth. My classmates and I studied hard on volcanos, sections of the earth, deepest points on earth and water and most importantly, Earthquakes.
The project my group (Jaxon, Zaid and Marcus) and I worked on was to create a structure out of raw spaghetti sticks and blue-tac. Raw spaghetti is very brittle so this wasn’t going to be an easy task but my team and I were up for the challenge.
The first stage was planning. During this we made up to 11 different sketches of how the structure will look. This included notes on earthquake resistant build techniques implemented by real world scientists and engineers. The most prominent build style was cross bracing.
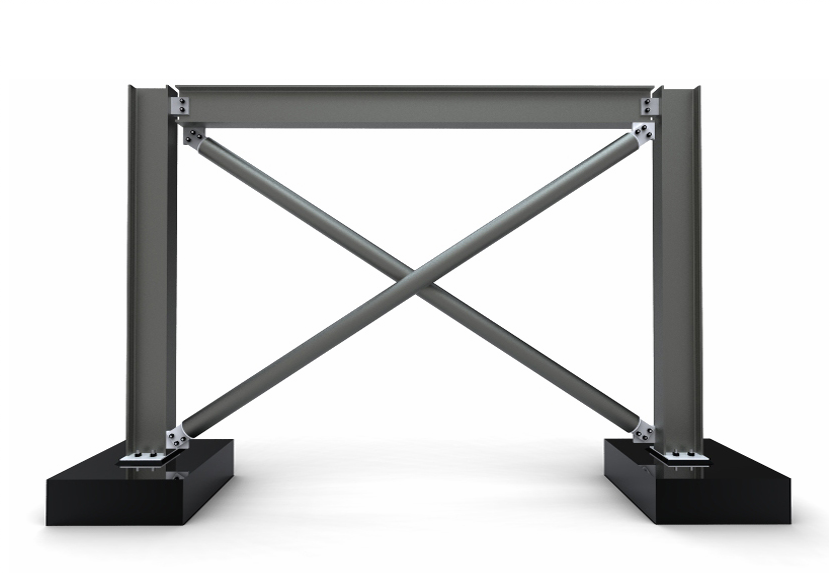
Cross bracing is a technique used by engineers that involves a cross between two pillars. This transfers weight away from the structure during an earthquake and reinforces the pillars it’s attached to. We included this type of wall on all three sides of our structures.
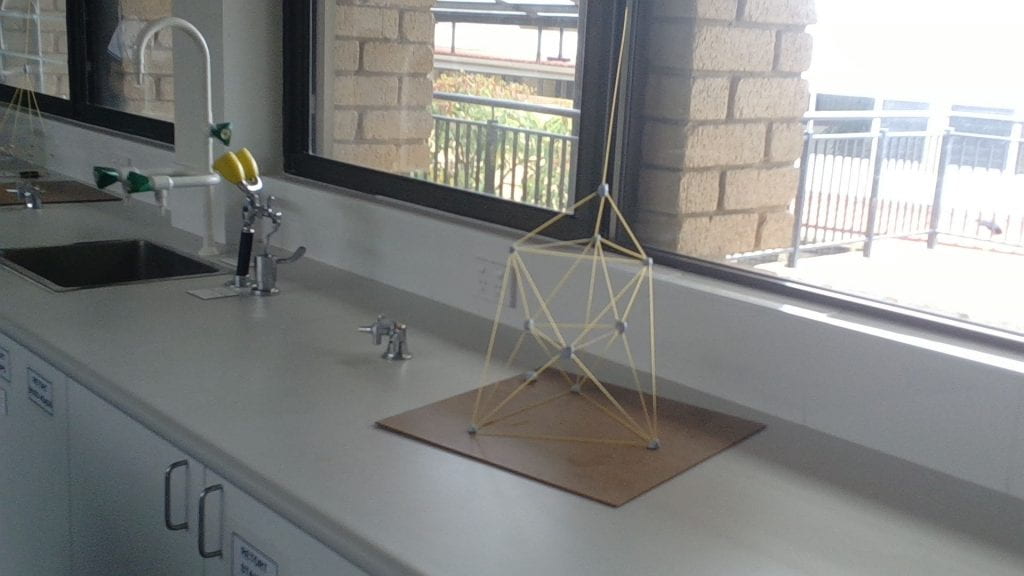
Our first structure was a huge success and it survived the shake test. It also met all of the requirements asked of us. But the problem with our design was the roof. The antenna swayed and appeared as if it would take the roof off. Fortunately it doesn’t but this is a risk that my team and I aren’t willing to take and it easily finds itself on the improvement list for design two.
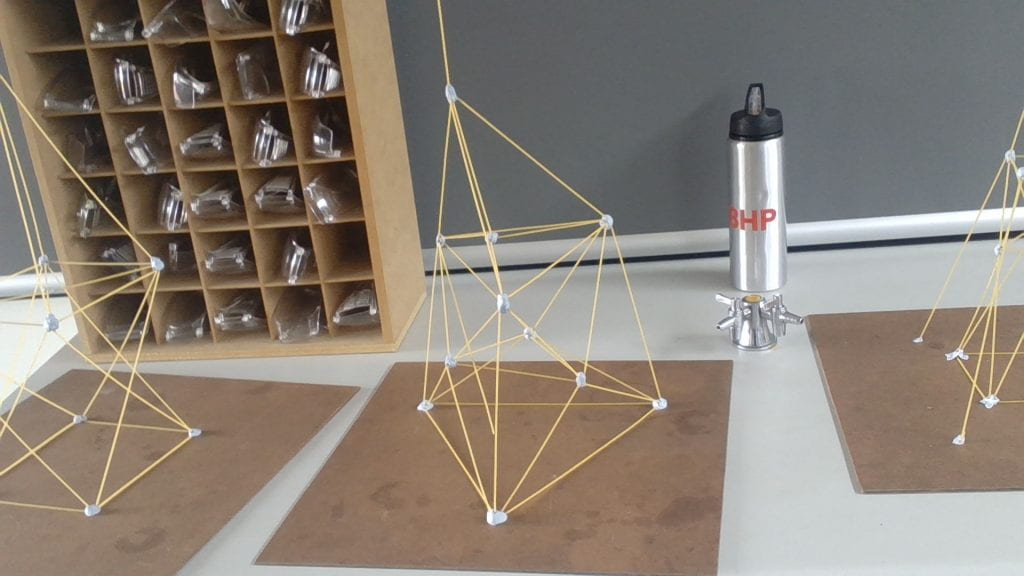
After noting down the parts of design one that needed improvement we reached the building stage. This was the final part of our project. Jaxon had drawn at least 10 different possible sketches since the time the project was released to us. But the final product was a disaster. As the due date drew nearer and nearer the builds became rushed. The first build was built entirely by Marcus but the second time around we all tried to build at once to speed things up. In the end we did implement the improvements and they did work. But it came at a cost of making the rest of our structure less so.
In the end I believe that our group worked very hard on this project. In the end our “Improved” Design was worse but through the way we all contributed equally to the project regardless of the outcome. I feel this was a good learning experience that my group members and I can take to future projects.