
In this task Callum and I studied wellbeing in Year 9 students. We found this by collecting data. This data consisted of the amount of hours that Year 9 Students spent in an average week on wellbeing. Wellbeing consists of activities such as: Sport, Art, Music, Relaxing, Going outside etc. Any activity that makes you feel good. The purpose of wellbeing is to clear your mind and make you feel at peace.
Since our data was in hours this was Numerical data. Although we could have also made a categorical data graph based on the types of wellbeing activities (Physical, Mental, Social).

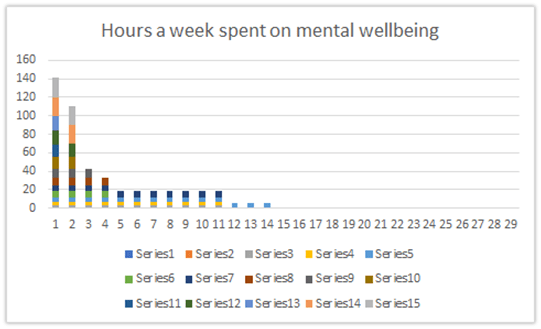
Our data we received from the graph
Outliers: 999 and 50
Mode: 0
Median: 4
Mean: 30.41
Quartiles: 1
Range: 21
Interquartile range: 2
The outliers
The outliers that we found were 999 and 50. It is clear that 999 was someone making a “funny” reply. Although this might have been the saddest thing I have ever seen. This person should improve their sense of humor if they want to go anywhere in life.
Interesting bits of data
In the data we collected I noticed that Exactly 11 people chose 2, 4 and 7 hours of wellbeing. I found this interesting because its quite coincidence that exactly 11 people chose these.
Conclusion
In our data the mode was 0. This may seem quite peculiar. I believe this is because most of the students actually do not know what wellbeing activities include. Granted, the term “Wellbeing” is an umbrella term for a variety of different activities. Making it a very interesting statistic indeed. I believe that our data could be improved by adding a categorical section. This would make our data a lot more reliable.